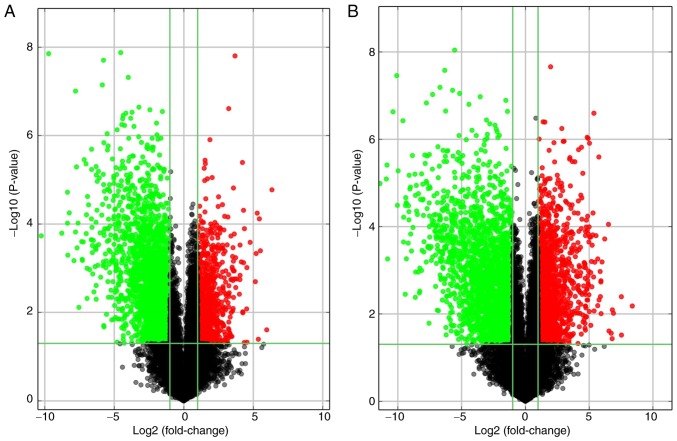
Figure 4.
Volcano plot filtering was performed to identify (A) long non-coding RNAs and (B) mRNAs with statistically significant differences in expression. Vertical green lines correspond to 2.0-fold upregulation and 2.0-fold downregulation of expression, and horizontal green lines indicate P=0.05. Thus, the red and green points in the plot indicate >2.0-fold upregulation and downregulation of expression with statistical significance.

