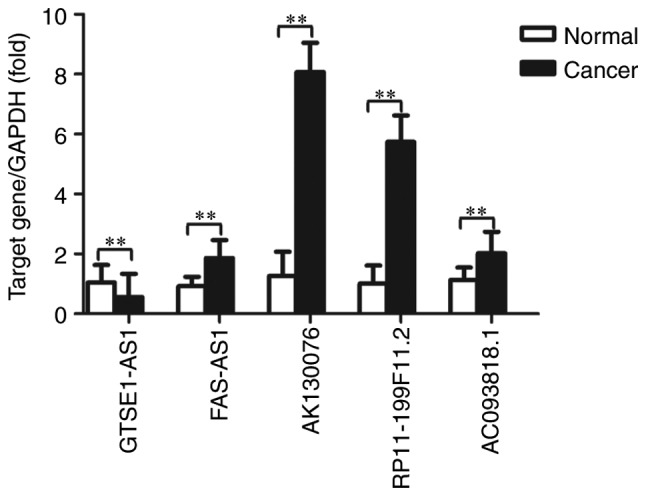
Figure 7.

Expression levels of GTSE1-AS1, FAS-AS1, AK130076, RP11-199F11.2 and AC093818.1 in high-grade ovarian serous cancer tissue samples and healthy fallopian tube tissue samples, measured by reverse transcription-quantitative polymerase chain reaction. Expression levels were normalized to GAPDH. Data are expressed as the mean ± standard deviation. **P<0.01, with comparisons indicated by lines. GTSE1-AS1, GTSE1 antisense RNA 1 (head to head); FAS-AS1, FAS antisense RNA 1.
