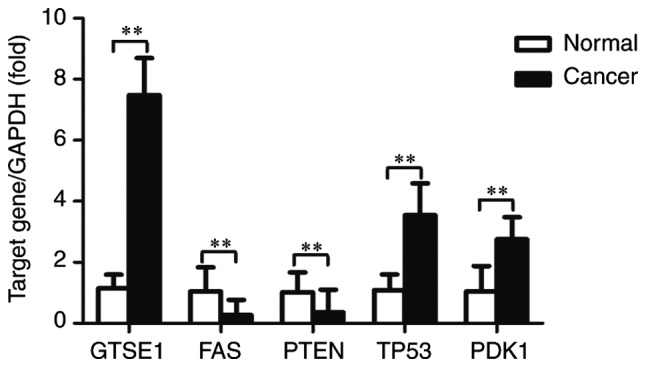
Figure 8.

Expression levels of GTSE1, FAS, PTEN, TP53 and PDK1 in high-grade ovarian serous cancer tissue samples and healthy fallopian tube tissue samples, measured by reverse transcription-quantitative polymerase chain reaction. Expression levels were normalized to GAPDH. Data are expressed as the mean ± standard deviation. **P<0.01, with comparisons indicated by lines. GTSE1, G2 and S-phase expressed 1; FAS, Fas cell surface death receptor; PTEN, phosphatase and tensin homolog; TP53, tumor protein p53; PDK1, pyruvate dehydrogenase kinase 1.
