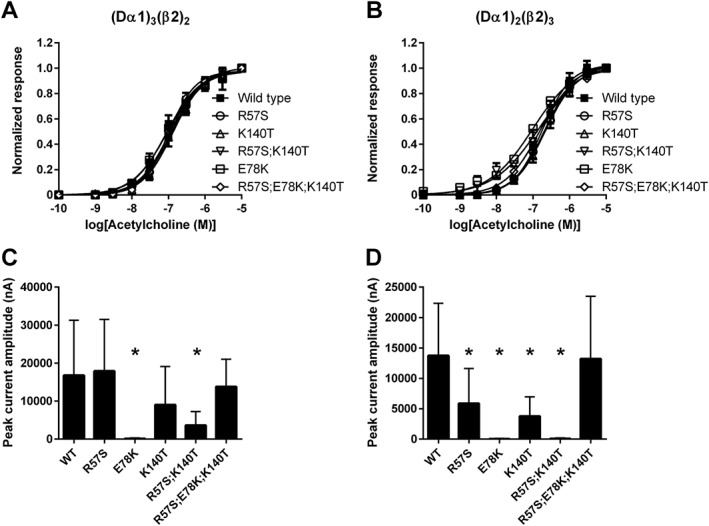
Figure 4.

Concentration–response curves for ACh observed in (Dα1)3(β2)2 and (Dα1)2(β2)3 hybrid nACh receptors expressed in X. laevis oocytes and peak current amplitude of the ACh‐induced responses. (A) Concentration–response curve for the (Dα1)3(β2)2 nACh receptor; (B) concentration–response curve for the (Dα1)2(β2)3 nACh receptor. (C) Peak current amplitude of the response of (Dα1)3(β2)2 nACh receptor to 10 μM ACh. (D) Peak current amplitude of the response of (Dα1)2(β2)3 nACh receptor to 10 μM ACh. Each data point in panels (A, B) represents mean ± SEM (n = 5), whereas each bar graph in panels (C, D) represents mean ± SEM (n = 17). In panels (C) and (D), significant differences of the peak current amplitude of the response induced by 10 μM ACh between the wild‐type and mutant nACh receptors are indicated by an asterisks (* P < 0.05).
