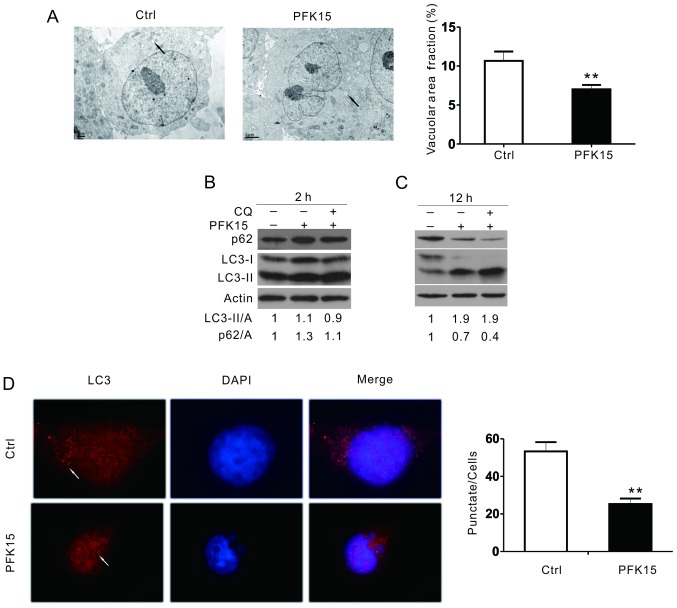
Figure 3.
PFK15 suppresses autophagy in RD cells. (A) Transmission electron microscopy examination of vacuolar structures in RD cells (arrows represent the autophagosome). Morphometric analysis of the area fractions between autophagosomes and cytoplasm were calculated using ImageJ software; area ratio data were not normally distributed and are presented as the mean of at least 20 cells counted for each group. (B) RD cells treated for 2 h or (C) 12 h with PFK15 (6 μM) in the presence or absence of CQ (10 μM) were examined by an immunoblotting assay. Densitometry was performed for quantification, and the adjusted ratios of LC3-II and p62 to actin are presented under the blots. (D) RD cells were cultured for 2 h with PFK15 (6 μM), and an immunofluorescence assay using LC3 antibody was performed, using DAPI as a nuclear stain. Data represent three independent experiments. *P<0.05 vs. control and **P<0.01 vs. control. RD, rhabdomyosarcoma; CQ, chloroquine diphosphate salt; LC3, light chain 3; Ctrl, control.

