Figure 3.
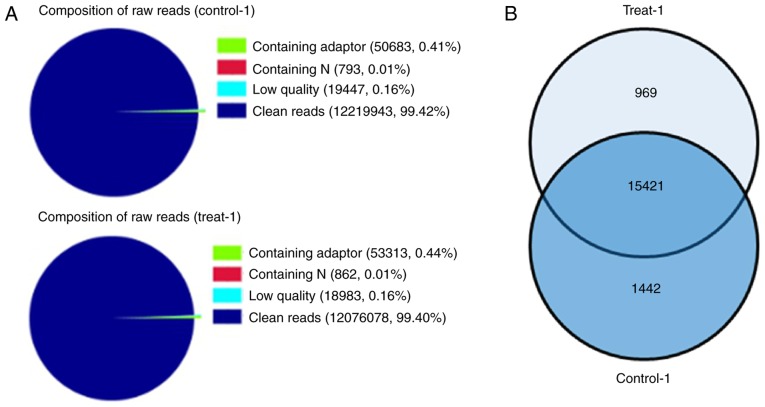
Differential expression of genes between the LIF-treated and control groups. (A) Sequencing quality assessment in each Digital Gene Expression library. Control-1, marmoset iPSCs cultured in the absence of LIF; Treat-1, marmoset iPSCs cultured in the presence of LIF. Different colors indicate the proportion distribution of reads. The data in parentheses indicate the number and percentage of corresponding tags among the total raw reads. Clean reads represents the raw sequence data without impurity, which is the basis for subsequent information analysis. (B) Venn diagram of the differentially expressed genes shared among the control and treatment groups. There were 15,421 genes shared between the two groups, and 969 and 1,442 genes were independently expressed by the treatment and control groups, respectively. iPSCs, induced pluripotent stem cells; LIF, leukemia inhibitory factor.

