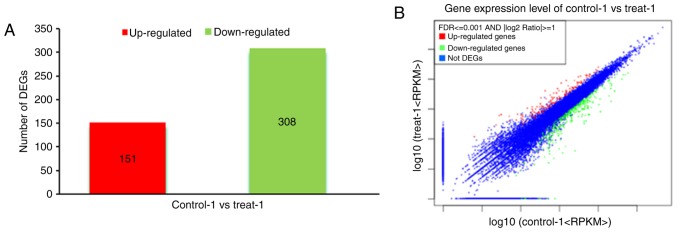
Figure 4.
Volcano plot for the control and treated datasets. (A) Red indicates the upregulated genes in the LIF-treated group compared with the control group. Green indicates the downregulated genes in the LIF-treated group. (B) Results showing the number of upregulated and downregulated genes between the control and treated datasets. Blue indicates genes without expression differences between the two samples. LIF, leukemia inhibitory factor; DEGs, differentially expressed genes.

