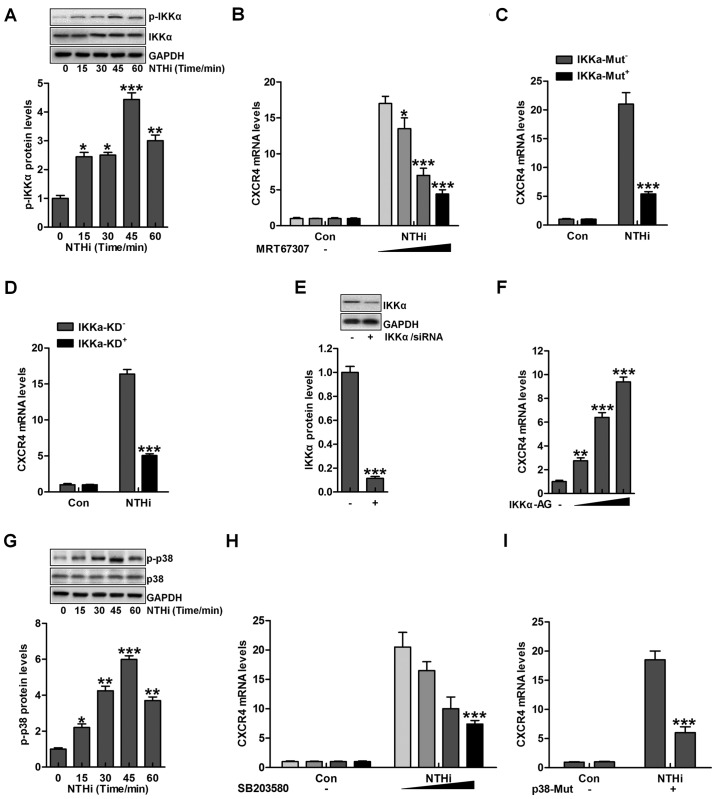
Figure 3.
Nontypeable Haemophilus influenzae (NTHi)-induced chemokine CXC receptor 4 (CXCR4) activation is related to IKKα and p38 MAPK activity. (A) Human middle ear epithelial cells (HMEECs) were exposed to NTHi for different times ranging from 0 to 60 min. Western blot analysis was used to investigate IKKα phosphorylation. *p<0.05, **p<0.01 and ***p<0.001 vs. the control group. (B) HMEECs were administered to IKKα inhibitor MRT67307 at various concentrations (0, 0.5, 1 and 2 µM) for 2 h, followed by CXCR4 gene level measurement through RT-qPCR analysis. *p<0.05, **p<0.01 and ***p<0.001 vs. the NTHi-treated group in the absence of MRT67307 treatment. (C) HMEECs were transfected with the Control, and IKKα-mutant plasmid. CXCR4 expression from the gene levels was determined by the use of RT-qPCR analysis. ***p<0.001 vs. the NTHi-treated group without IKKα mutation. (D) HMEECs were transfected with the Control, and IKKα-silence for knockdown. CXCR4 mRNA expression levels were detected by RT-qPCR assays. ***p<0.001 vs. the NTHi-treated group without IKKα silence. (E) After IKKα knockdown, western blot analysis was carried out to calculate CXCR4 expression from the protein levels. ***p<0.001 vs. the control group. (F) HMEECs were treated with or without IKK activator at different concentrations (0, 0.5, 1 and 2 µM) for 12 h. Next, CXCR4 mRNA levels were determined by RT-qPCR analysis. **p<0.01 and ***p<0.001 vs. the control group without any treatment. (G) HMEECs were exposed to NTHi for different times (0 to 60 min). Then, western blot analysis was performed to calculate phosphorylated p38 activation. *p<0.05, **p<0.01 and ***p<0.001 vs. the control group. (H) HMEECs were pretreated with p38 inhibitor at various concentrations (0, 0.5, 1 and 2 µM) for 2 h, followed by CXCR4 gene level measurement through RT-qPCR analysis. ***p<0.001 vs. the NTHi-treated group without SB203580 treatment. (I) HMEECs were transfected with the Control, and p38-mutants plasmid. CXCR4 expression levels were calculated by RT-qPCR assays. ***p<0.001 vs. the NTHi-treated group without p38 mutation. Representative data are shown as SEM.

