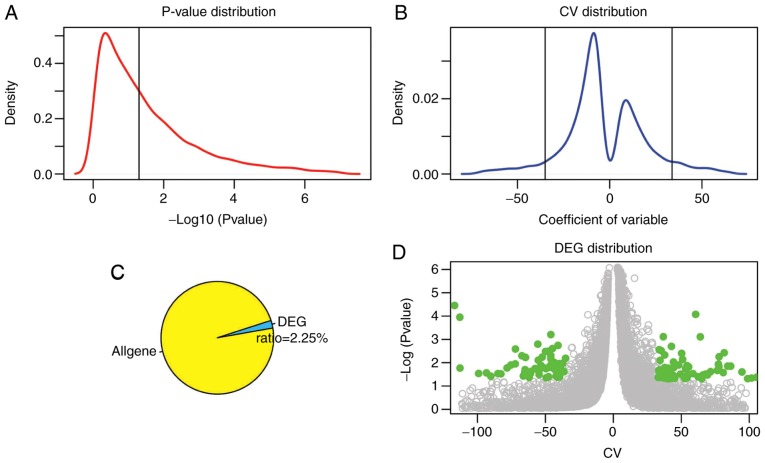
Figure 1.
DEG screening. (A) P-value distribution. The black vertical line represents the threshold of P=0.05 [−log (0.05)=1.3]. (B) CV distribution. Two black vertical lines represents 10% CV and 90% CV, respectively (−35.1, 33.8). (C) Ratio of DEGs in all genes. (D) DEG distribution; green points represent DEGs and grey points represent other genes. DEGs, differentially expressed genes; CV, coefficient of variation.

