Figure 5.
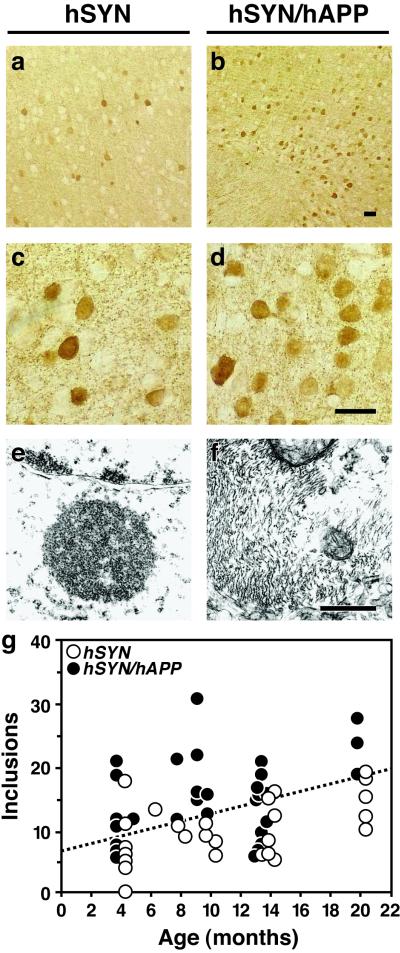
Increased number and fibrillar characteristics of neuronal inclusions in hSYN/hAPP mice. (a–d) Brain sections were labeled with an antibody against hSYN (72) and analyzed by light microscopy. hSYN/hAPP mice (b and d) had more hSYN-immunoreactive neuronal inclusions in the temporal cortex (depicted here) and in the cingulate cortex (not shown) than hSYN mice (a and c). Images are from 12-month-old mice. (Scale bars, 20 μm.) (e and f) Sections of temporal cortex from 12-month-old hSYN (e) or hSYN/hAPP (f) mice were analyzed by transmission electron microscopy. Images depict intraneuronal inclusions. (Scale bar, 1 μm.) (g) hSYN-immunoreactive neuronal inclusions increased with age in both hSYN (r = 0.51, P = 0.006) and hSYN/hAPP (r = 0.39, P = 0.027) mice. Each dot represents measurements obtained in the temporal cortex of a different mouse expressed as average number of hSYN-immunoreactive inclusions per mm2.

