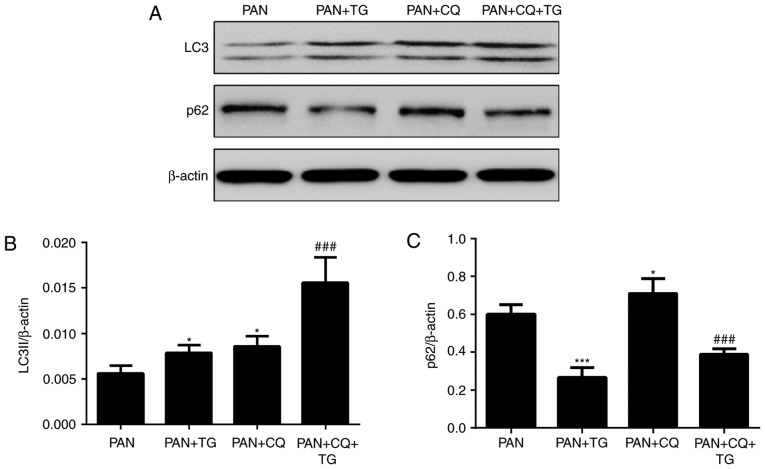
Figure 3.
Effects of TG on the autophagy of podocytes. The levels of autophagic markers were detected by western blot analysis. (A) Representative bands of LC3 and p62 in the individual groups. Bar graphs show the relative protein expression of LC3II and p62. (B) TG and CQ promoted the expression of LC3II in podocytes. (C) Expression of p62 was markedly decreased in the PAN+TG group and PAN+CQ+TG group, compared with that in the PAN group and the PAN+CQ group, respectively. Data are presented as the mean ± standard deviation (n=3). *P<0.05 and ***P<0.001 vs. PAN group; ###P<0.001 vs. PAN+CQ group. TG, tripterygium glycoside; PAN, puromycin aminonucleoside; CQ, chloroquine.

