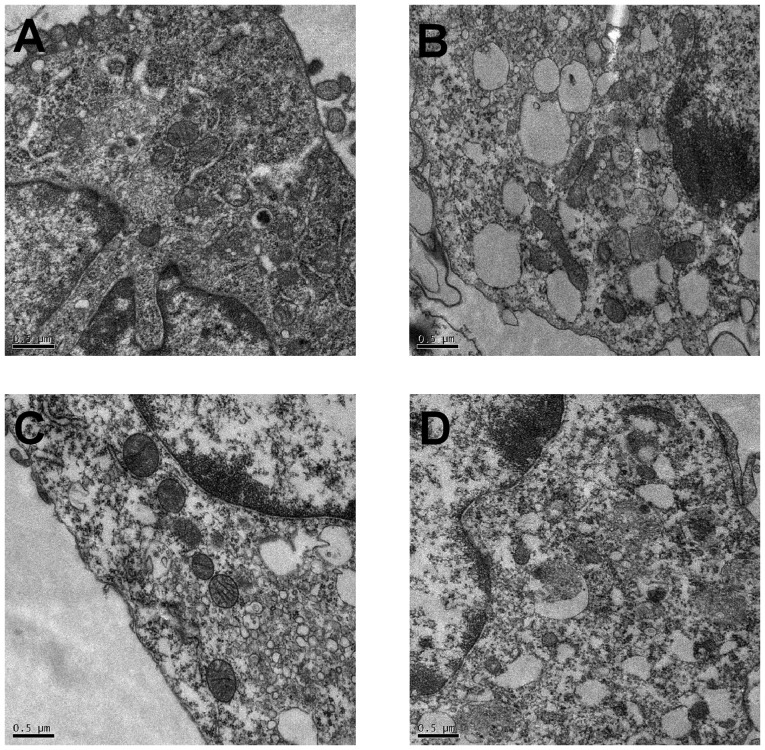
Figure 5.
Autophagosomes detected by transmission electron microscopy in the podocytes of individual groups. Autophagosomes were detected by transmission electron microscopy (magnification, ×20,000). (A) Numerous autophagosomes were observed in the cytoplasm of podocytes in the control group. (B) Compared with the control group, the number of autophagosomes was markedly lower in the PAN-treated podocytes. (C) Compared with the control group, the number of autophagosomes was markedly increased following TG treatment. (D) Compared with the PAN group, the number of autophagosomes was increased following TG treatment. TG, tripterygium glycoside; PAN, puromycin aminonucleoside.

