Figure 7.
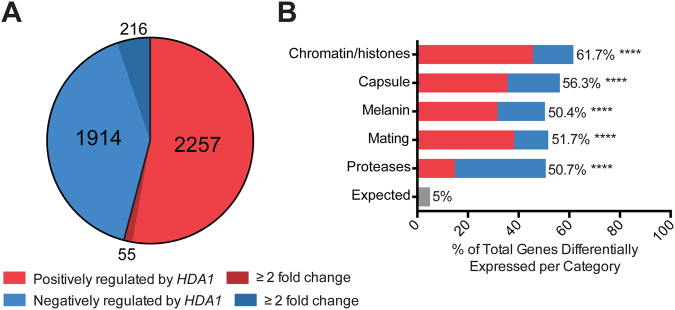
The transcriptional signature of the hda1∆ mutant versus wild-type. (A) Hda1-dependent upregulated and downregulated genes in the hda1∆ mutant versus wild-type as determined by two independent RNA-Seq analysis pipelines. Graph represents values from STAR/DeSeq2 analysis. (B) Modified gene ontology enrichment analysis of Hda1-dependent genes. The percent of genes differentially expressed in the hda1∆ strain versus wild-type in each category is plotted on the x-axis. Colors represent the proportion of differentially expressed genes in each category positively or negatively regulated by HDA1. Statistical test: Chi-square of observed versus expected frequency of 5%; ****p < 0.0001.

