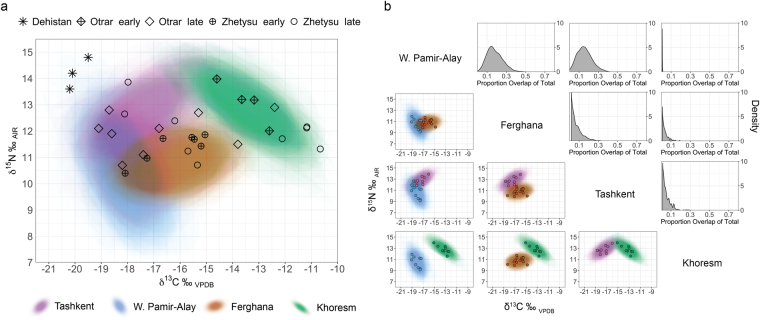
Figure 4.
(a) Medieval urban isotopic niches from Uzbekistan are displayed as probability clouds, and individual isotopic values from southern Kazakhstan (nomadic communities) and western Turkmenistan (urban community) are represented as points. (b) Isotopic niche overlap analysis for urban communities in Uzbekistan. Standard ellipses covering 95% of δ13C and δ15N values were modelled using Bayesian inference. Overlapping areas for each pairwise comparisons in δ-space were visualized as probability clouds with underlying isotopic data points superimposed (lower left). Area overlap of total isotopic niche area for each pair was plotted as probability distributions (upper right).

