Figure 3.
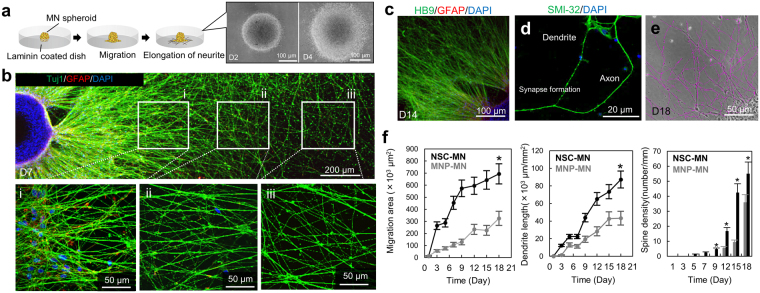
Morphogenesis of NSC-MN and MNP-MN spheroids. (a) To test the elongation of neurites, MN spheroids were reseeded on laminin-coated dishes and migration and elongation of MNs was observed and quantified. Representative images of morphological change of NSC-MN spheroids. (b) MN neurites from NSC-MN spheroids were visualized by immunostaining of HB9, GFAP, and DAPI at three different regions (i, ii and iii). Note that the regions marked in the zoomed-out view are representative. Both soma and neurites can be seen in (i), a few soma and neurites in (ii), and only neurites in (iii). (c) after 14 days of seeding, characterization stained by HB9, GFAP, and SMI-32 (d). (e) To calculate neurite properties, image processing is conducted. (f) Quantitative comparison between NSC-MN spheroids and MNP-MN spheroids in terms of migration area, neurite length and spine density. NSC-MN spheroids have a higher potential of migration, neurite elongation, and spine density. n = 3; *P < 0.01, one-way ANOVA between NSC-MN and MNP-MN. Error bars ± SD.

