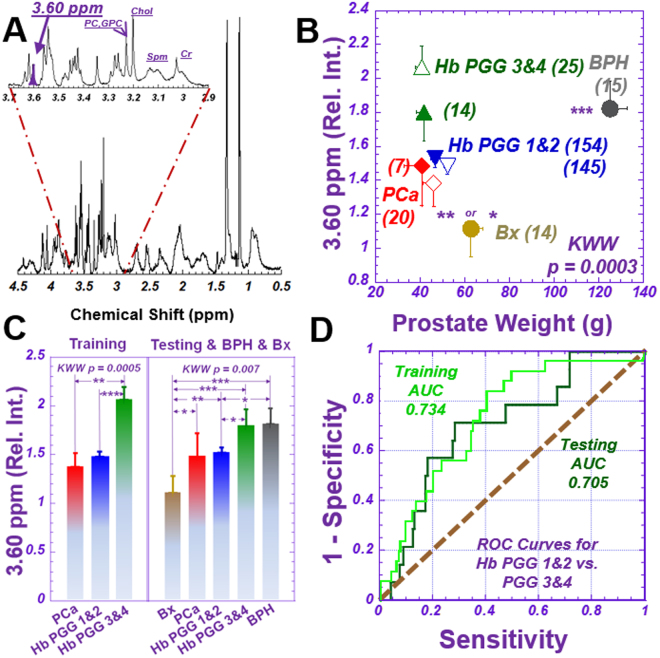
Figure 2.
Differentiation of Prostate Cancer Prognostic Grade Groups (PGG). (A) A representative tissue proton MRS spectrum measured from a 10 mg tissue sample containing 49.7 (Vol%) cancer, 20.7 (Vol%) histologically-benign glands, and 30.0 (Vol%) stromal tissues. The sample was obtained from a 62-year-old patient of GS = 4 + 3 (PGG3) and pathological stage pT = IIc disease. The spectral region at 3.60 ppm (purple peak) represents the metabolites m-Ino, GPC, PC and Val, as well as other major metabolites. (B) Mean and standard error of relative spectral intensities at 3.60 ppm, according to prostate weight, for tissue samples of training (open symbols) and testing (solid) cohorts and of BPH (grey) and Bx (tan). Blue triangles represent Hb samples in PGG1&2; green triangles show PGG3&4. Prostate cancer samples are red diamonds. Numbers in parentheses denote group size. Significance symbols on BPH and Bx denote significance levels when these groups were compared with all others. (C) Comparisons of relative spectral intensities of the peak at 3.60 ppm among groups in the training and testing cohorts, respectively. Comparision details between PGG1&2 and 3&4 are: Training: PGG1&2 Mean = 1.49 ± 0.06, Upper 95%CI = 1.60, Lower 95%CI = 1.37; PGG3 & 4: Mean = 2.07 ± 0.15, Upper 95%CI = 2.36, Lower 95%CI = 1.78, p < 0.0003; Testing: PGG1 & 2: Mean = 1.53 ± 0.04, Upper 95%CI = 1.60, Lower 95%CI = 1.45; PGG3 & 4: Mean = 1.80 ± 0.12, Upper 95%CI = 2.04, Lower 95%CI = 1.56, p < 0.0114), where Upper 95%CI and Lower 95%CI indicate upper and lower confidence intervals, respectively. (D) ROC curves presenting the overall accuracy of relative spectral intensities at 3.60 ppm for differentiating PGG1&2 from PGG3&4 groups for samples in the training and testing cohorts, respectively.

