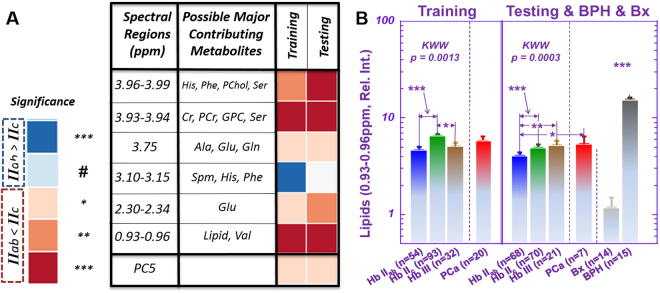
Figure 3.
Differentiation of pathological stages. Signifiance levels (***, **, and *) are defined in the text, whereas the ‘#’ notation indicates a one-sided test with p < 0.05. (A) Multiple spectral regions showed a potential to differentiate pT = IIab from pT = IIc groups. (B) For one of these regions, (0.93–0.96), Kruskal-Wallis-Wilcoxon (KWW) results are also shown for comparing pT = IIab, pT = IIc, and pT = III groups. The major contributing metabolites to the relative spectral intensities at 0.93–0.96 ppm are mostly free lipids, with very limited intensity from Val. Means and standard errors are plotted in the figure. The notation ‘***’ above the BPH and Bx groups indicates that both groups are significantly different from all other groups. The comparision details between IIab and IIc are: Training: IIab: Mean = 4.66 ± 0.40, Upper 95%CI = 5.45, Lower 95%CI = 3.88; IIc: Mean = 6.48 ± 0.31, Upper 95%CI = 7.09, Lower 95%CI = 5.88, p < 0.0013; Testing: IIab: Mean = 4.07 ± 0.17, Upper 95%CI = 4.41, Lower 95%CI = 3.73; IIc: Mean = 4.98 ± 0.17, Upper 95%CI = 5.31, Lower 95%CI = 4.65, p < 0.0003.

