Figure 4.
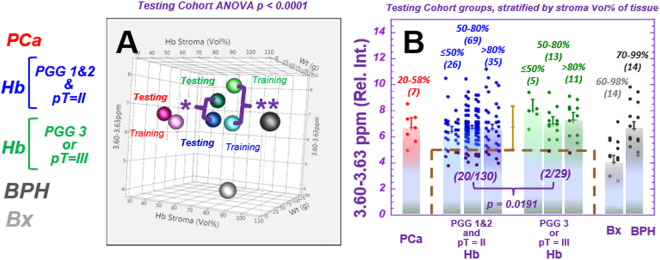
Spectral region 3.60–3.63 ppm shows distinguishing power between low and high aggressive cases. The patient population was divided into (1) Low aggressiveness cases: PGG1&2 and pT = II (Blue, 58 cases for both the training and testing cohorts, and 139 and 130 individual samples for each cohort, respectively); and (2) High aggressiveness cases: PGG3 or pT = III (green, 13 and 14 cases for each cohort, respectively, and 29 individual samples for each cohort). (A) A 3D illustration of the mean values of relative spectral intensities at 3.60–3.63 ppm (m-Ino) of samples in the training and testing cohorts vs. stroma composition (Vol%) in the tissue and prostate weight. Prostate cancer samples (red), Hb groups organized according to High (green) and Low (blue) aggressiveness, BPH (dark grey) and Bx (silver) are shown. The training and testing cohorts are represented by light and dark symbols, respectively. Significant differences (ANOVA p < 0.0001) are observed among groups in the testing cohort (including BPH and Bx groups) and for all groups (Hb, High 7.54 ± 0.27; Hb, Low 6.55 ± 0.12; prostate cancer 6.50 ± 0.39; BPH 6.64 ± 0.52; and Bx 4.04 ± 0.53). (B) For samples stratified by Vol% stroma, a Kruskal-Wallis-Wilcoxon comparison of relative spectral intensities at 3.60–3.63 ppm from Hb samples shows statistical significance in differentiating Low from High aggressive groups for the testing cohort. Furthermore, this region could identify a subgroup (20/130) of samples in the Low aggressive group (magenta points in the brown dashed box), using a threshold of one standard deviation below the mean calculated for all Hb testing cohort samples. This differentiation capability is independent from that of tissue stroma composition. Values above parentheses represent the amount (vol%) of stroma in the samples, and numbers in parentheses denote the number of samples in the group. The comparision details between High and Low are: Training: High: Mean = 7.81 ± 0.43, Upper 95%CI = 8.66, Lower 95%CI = 6.96; Low: Mean = 6.50 ± 0.20, Upper 95%CI = 6.89, Lower 95%CI = 6.11, p < 0.0026; Testing: High: Mean = 7.27 ± 0.31, Upper 95%CI = 7.88, Lower 95%CI = 6.66; Low: Mean = 6.60 ± 0.15, Upper 95%CI = 6.88, Lower 95%CI = 6.31, p < 0.0191.

