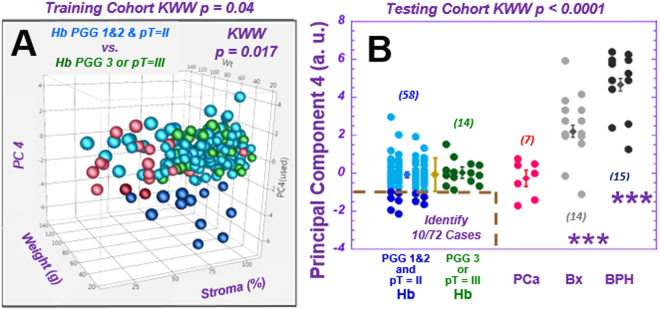
Figure 5.
Identification of a sub-group of prostate cancer cases with low aggressive potential. (A) A 3D illustration of the mean values of principal component (PC) 4, as calculated from individual Hb samples vs. prostate weight and the percentage of stroma in samples for the training cohort. The subgroup of samples in the Low aggressive group, identified by a threshold of one standard deviation below the mean (M-SD), is highlighted by dark blue points. (B) The values of PC4 calculated for the testing cohort according to parameters obtained from the training cohort can identify 10 from 58 (17%) Low aggressive cases, using the threshold of M-SD measured from Hb samples (below the brown dashed line). Prostate cancer, BPH, and Bx values are also presented for references.

