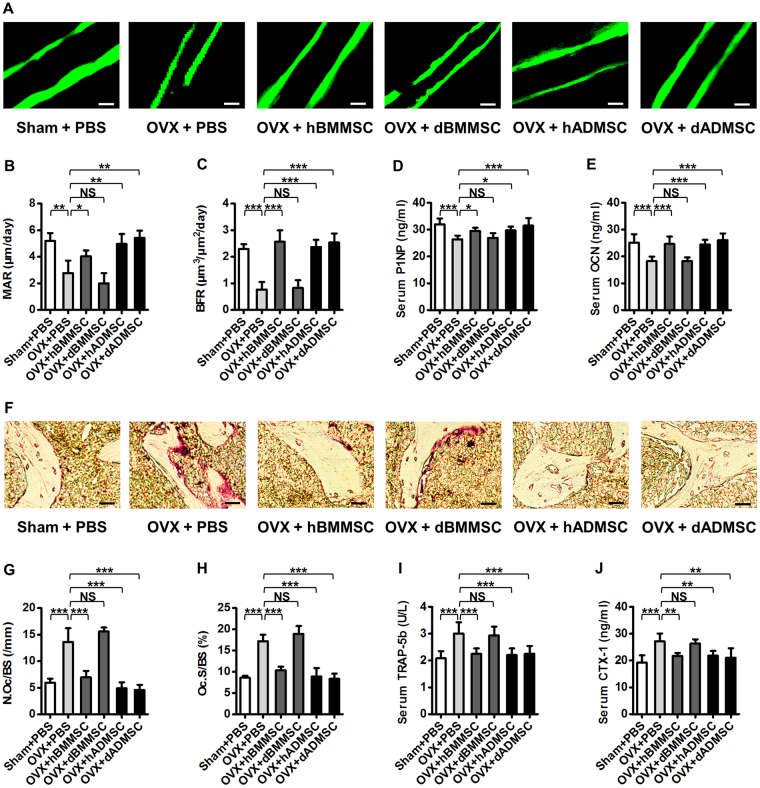
Figure 3.
Bone remodelling changes after infusion of Sham and osteoporotic donor-derived MSCs. (A–C) Representative images of calcein labelling (A) and parameters of bone formation rates (B,C) in distal femora harvested at D28 post operation. Bars: 50 μm. n = 3 per group. (D,E) ELISA analysis of serum levels of bone formation markers P1NP (D) and OCN (E). n = 6 per group. (F–H) Representative images of TRAP staining (F) and parameters of bone resorption rates (G,H) in distal femora harvested at D28 post operation. Bars: 25 μm. n = 3 per group. (I,J) ELISA analysis of serum levels of bone resorption markers TRAP-5b (I) and CTX-1 (J). n = 6 per group. Data are shown as mean ± SD. *P < 0.05, **P < 0.01 and ***P < 0.001. NS, not significant (P > 0.05). Data were analysed using ANOVA followed by Newman-Keuls post-hoc tests.

