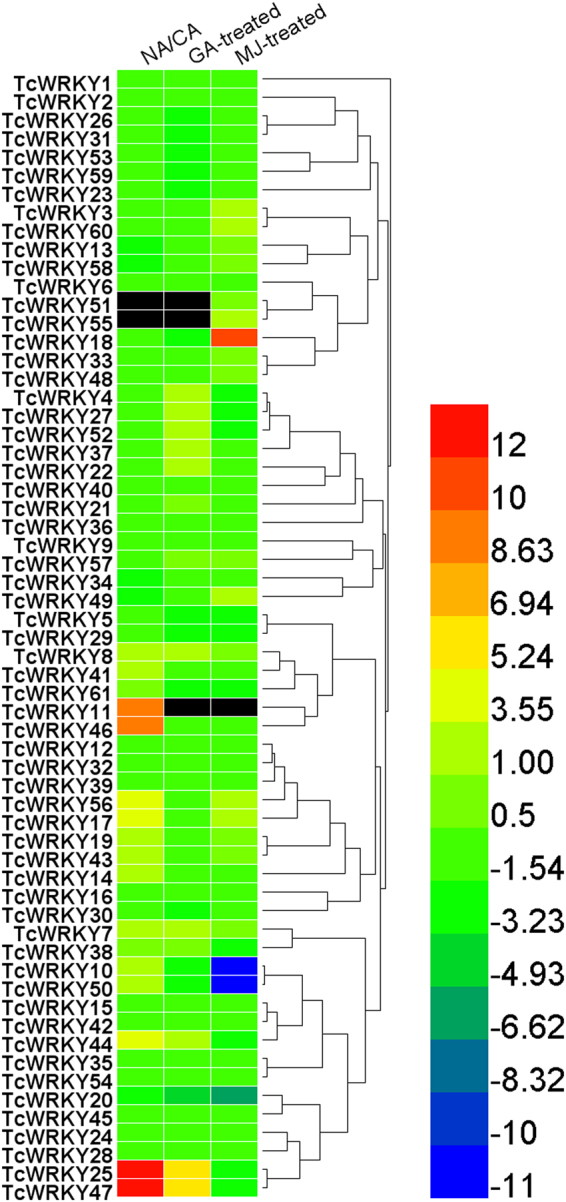
Figure 5.

Expression profiles of 61 TcWRKYs. Expression profiles of 61 TcWRKYs were analyzed according to three transcriptome datasets. NA was newly isolated Taxus cells while CA was 10-years long-term subcultured cells, the taxol content between the two samples was highly different (Zhang et al., 2015)21. MeJA (methyl jasmonate acid)-treated (Li et al., 2012)20 and GA (gibberellin)-treated (unpublished work) mean the cells were treated by MeJA for 15 h and GA for 6 h respectively. The heatmap was generated by Heml 1.0 software (http://hemi.biocuckoo.org/). The black boxes indicated that these TcWRKYs were not found in the dataset.
