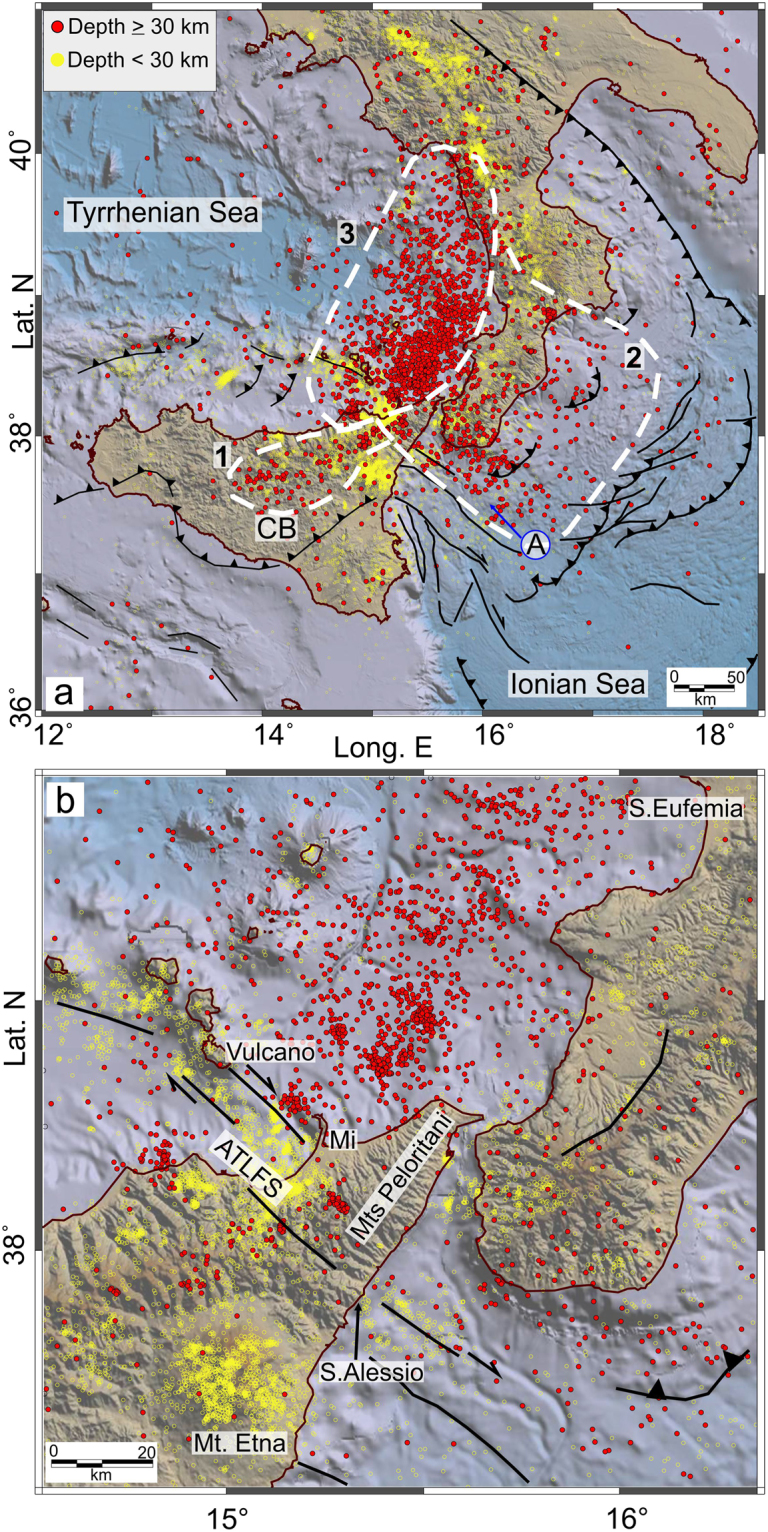
Figure 3.

Final event locations. Numbers and white dashed lines denote the identified seismogenic domains (see Results for further details). The circled letter A indicates features described in the text. The main tectonic structures are also shown. Topography is from ref.46. The maps were created using QGIS (version 10.2.1; http://qgis.org) and Generic Mapping Tools (GMT version 4.5.6; http://gmt.soest.hawaii.edu). The figure was edited using Corel Draw Graphics Suite (version X5; http://www.corel.com).
