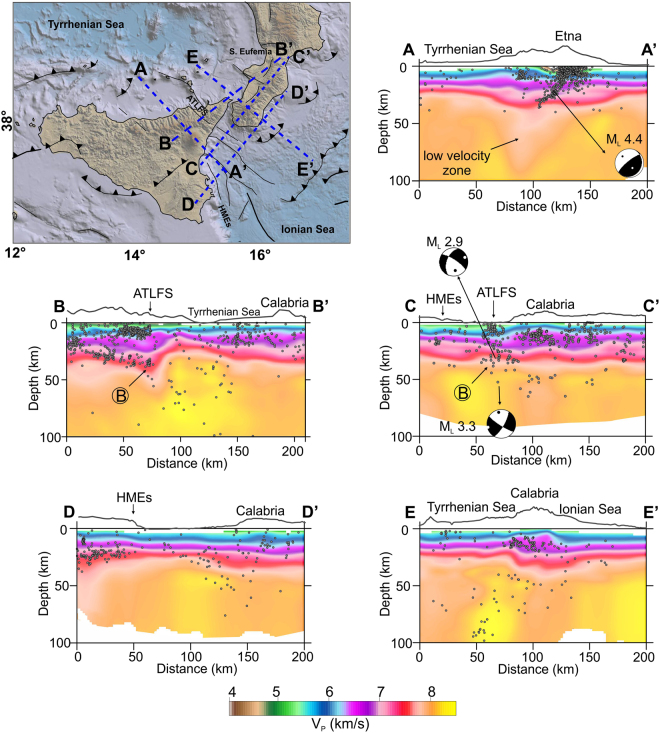
Figure 4.
Vertical sections through the VP model, in km/s. Relocated earthquakes, within ±5 km from the cross-section lines, are plotted as grey dots. Focal solutions are by refs20,30. Topographic profiles at the top of the sections are only indicative of the geographic location. Circled letters indicate features described in the text. The traces of the sections (AA’, BB’, …) are reported in the sketch map. Topography is from ref.46. The figure was obtained using the software Surfer (version 10.7.972; http://www.goldensoftware.com/products/surfer) and QGIS (version 10.2.1; http://qgis.org). The plot was edited using Corel Draw Graphics Suite (version X5; http://www.corel.com).

