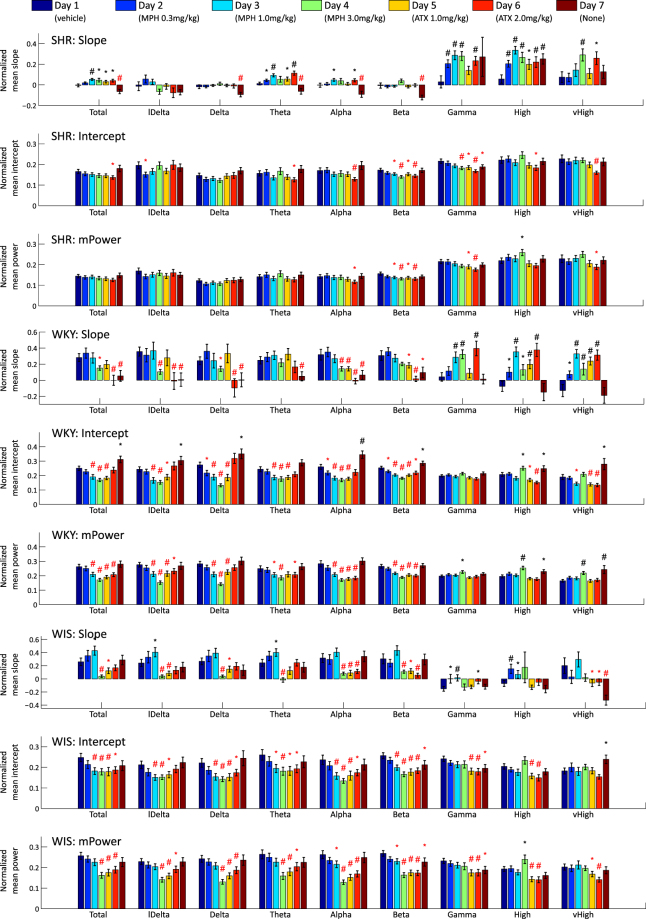
Figure 3.
Result of experimental conditions in SHR, WKY, and WIS: Average and standard error of the mean (SEM) of slope, intercept and mPower parameters are depicted as bar and error bar. The marks ‘*’ and ‘#’ indicate the results of the statistical significance test, the one-tailed t-test, between the vehicle and other specific pharmacological agent administration for which the significant levels are 0.05 and 0.01, respectively. Positive and negative significance are colour-coded using black and red, respectively.

