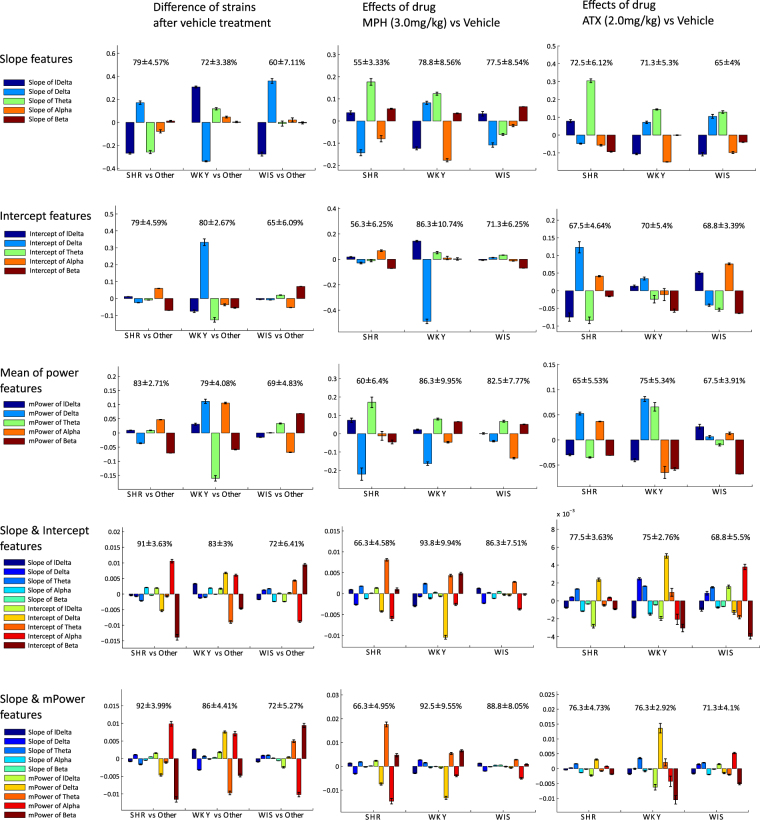
Figure 5.
Results of average and SEM of weighting values of individual biomarkers and their classification rates. We focused on the difference in strains after the vehicle administration (left column), effects of MPH (centre column) and ATX (right column) compared with the vehicle, and discerned the weighting parameters via FDA for slope features (panel A), intercept features (panel B), mPower features (panel C), both slope and intercept features (panel D), and both slope and mPower features (panel E) in lDelta–Beta frequency bands. Bar plots depict the average and SEM of individual normalized weighting parameters, and values show average ±SEMs of classification rates via 10-fold CV test. Since the scale of slope and intercept parameters, and individual frequency bands are quite different (e.g., lDelta > delta > Theta > Alpha > Beta), individual weighting parameters were normalized depending on the individual scale, as ascertained for this visualization. Note that this normalization does not have any effect on the classification accuracy.

