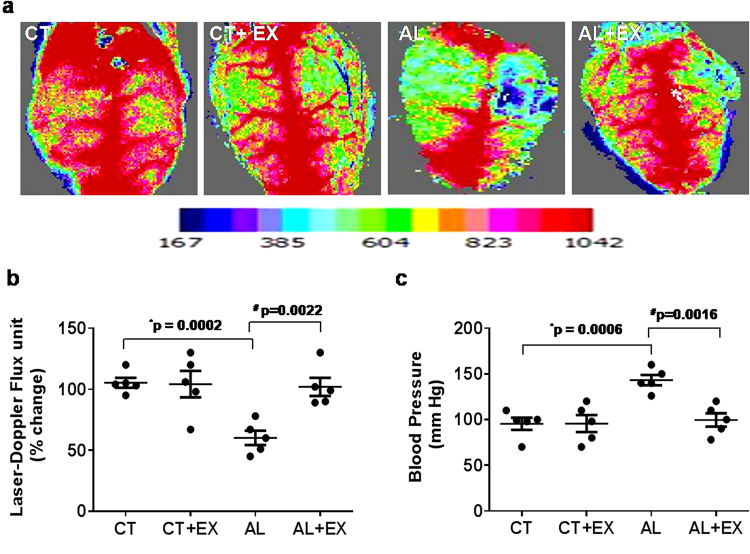
Figure 2.
(a) Representative images showing microvascular density in the brain using laser Doppler flow in the different mice groups. (b) Scatter dot plot representing flux units of microvascular density captured in the 6 different areas in the cranial window prepared in the different groups of mice. (c) Dot plot of mean arterial blood pressure data in different mice groups. Data are represented as mean values ± standard error (SE) in 5 independent experiments. *,#p < 0.05 considered significant. *p < 0.05 vs. CT and #p < 0.05 vs. AL group.

