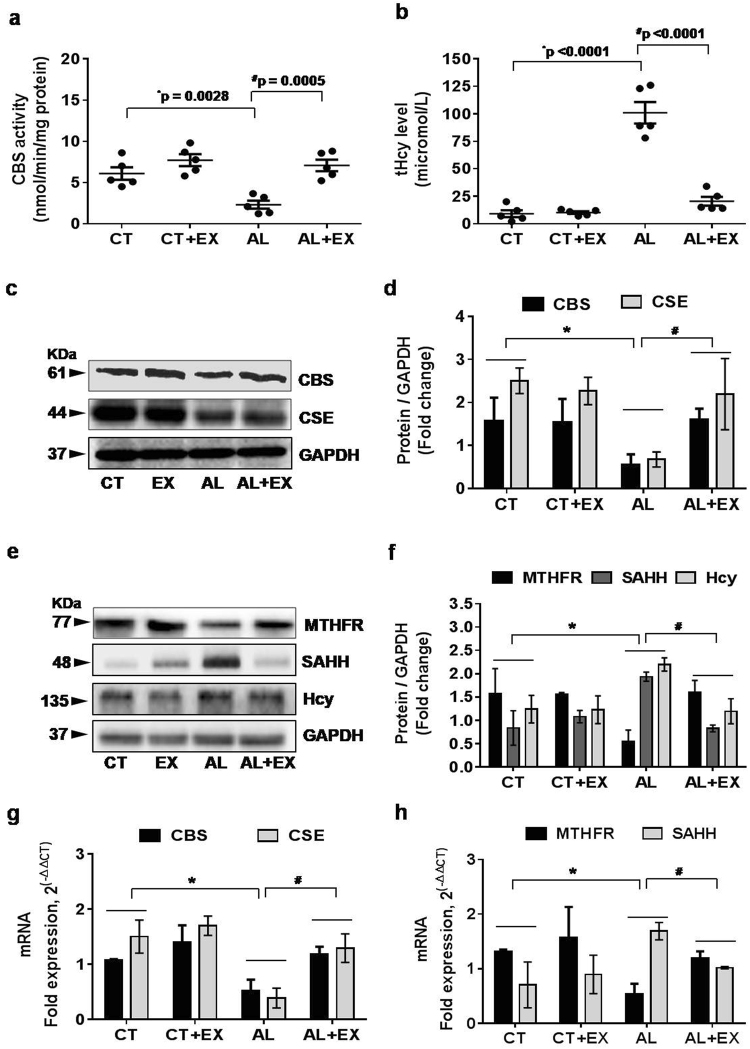
Figure 3.
Alcohol interferes with Hcy metabolism leading to hyperhomocysteinemia (HHcy). (a,b) Scatter dot plots represent data for the CBS enzyme activity and total homocysteine (tHcy) levels in the different mice groups. (c–f) Representative western blot analysis for the vital enzymes (CBS, CSE, MTHFR, SAHH and Hcy) involved in homocysteine metabolism in different mice groups. Bar graphs showing quantitative estimation of key proteins after normalization with GAPDH. (g,h) q-PCR analysis showing the data for real‐time transcript levels of CBS, CSE, MTHFR and SAHH mRNAs in the different groups of mice. All the data are represented as mean values ± standard error (SE) in 5 independent experiments. *,#p < 0.05 considered significant. *p < 0.05 vs. CT and #p < 0.05 vs. AL group.Uncropped blots for c and e are presented in Supplementary Figs 1 and 2.

