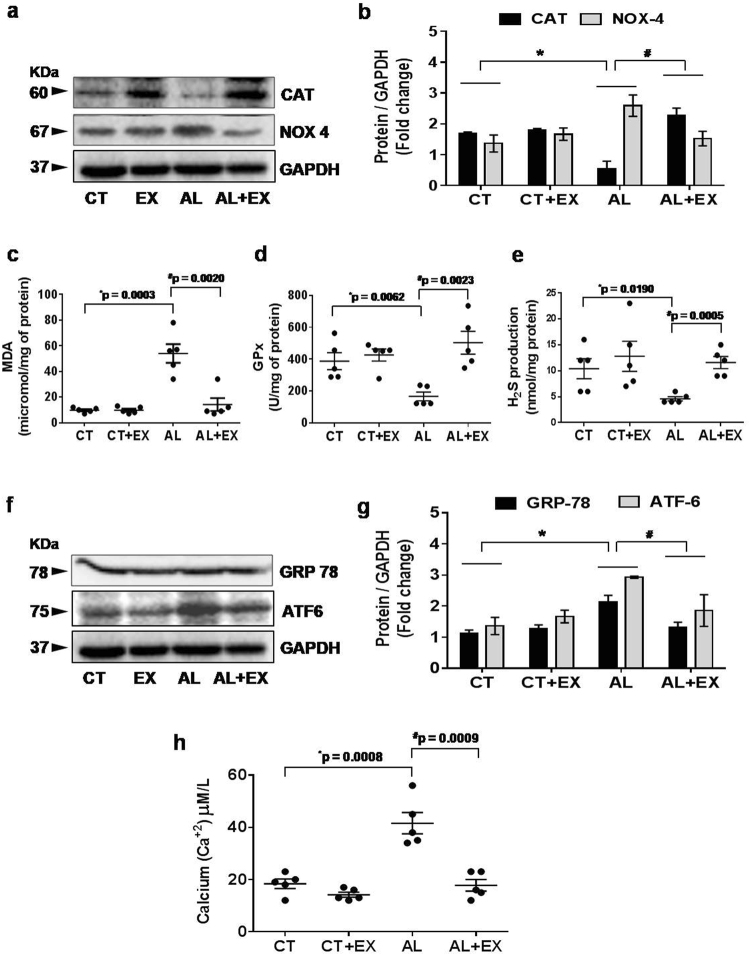
Figure 4.
Effect of exercise on alcohol induced oxidative and endoplasmic reticular (ER) stress. (a,b) Representative western blot analysis showing the levels of antioxidant marker CAT and oxidative stress marker NOX4 in the different mice groups. Bar graphs showing the quantitative estimation of CAT and NOX4 proteins after normalization with GAPDH. (c–e) Scatter dot plots representing the levels of malondialdehyde (MDA), glutathione peroxidase (GPx) and production of H2S in brain tissue in different mice groups. (f,g) Representative western blot analysis showing the levels of GRP78 and ATF6 (hallmarks of ER stress) in the different groups of mice. Bar graphs showing the quantitative estimation of GRP78 and ATF6 proteins after normalization with GAPDH. (h) Scatter dot plot represents data for the cellular calcium ion (Ca+2) level in brain tissue extract of different mice groups. All the data are represented as mean values ± standard error (SE) in 5 independent experiments. *,#p < 0.05 considered significant. *p < 0.05 vs. CT and #p < 0.05 vs. AL group. Uncropped blots for a and f are presented in Supplementary Fig. 3.

