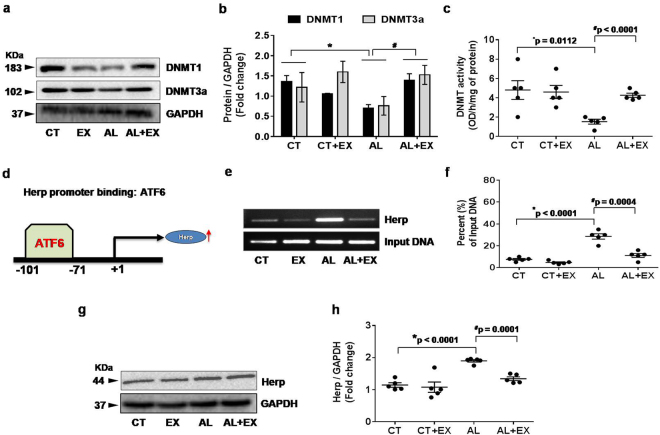
Figure 5.
Effect of exercise on alcohol induced DNA methyltransferase (DNMT) activity and transcriptional regulation through ATF6-Herp signaling. (a–c) Representative western blot analysis showing the levels of DNMT1 and DNMT3a in brain tissue extract from the different mice groups. Bar graphs showing the quantitative estimation of DNMT1 and DNMT3a proteins after normalization with GAPDH. Scatter dot plot representing the DNMT activity in brain tissue of different mice groups. (d–f) ChIP assay to examine the ER activated ATF6 binding to the endogenous Herp promoter in vivo. After cross linking and immunoprecipitation with ATF6 antibody from isolated brain tissue extract, PCR was performed to identify the presence of Herp promoter DNA using primers flanking the CpG islands in the Herp promoter sites. Scatter dot plot representing the percent of input DNA in different experimental mice groups. (g,h) Representative western blot analysis showing the levels of Herp protein expression in brain tissue extract from the different mice groups. Scatter dot plot showing the quantitative estimation of Herp proteins after normalization with GAPDH. All the data are represented as mean values ± standard error (SE) in 5 independent experiments. *,#p < 0.05 considered significant. *p < 0.05 vs. CT and #p < 0.05 vs. AL group. Uncropped blots for a,e,g are presented in Supplementary Figs 4 and 5.

