Figure 6.
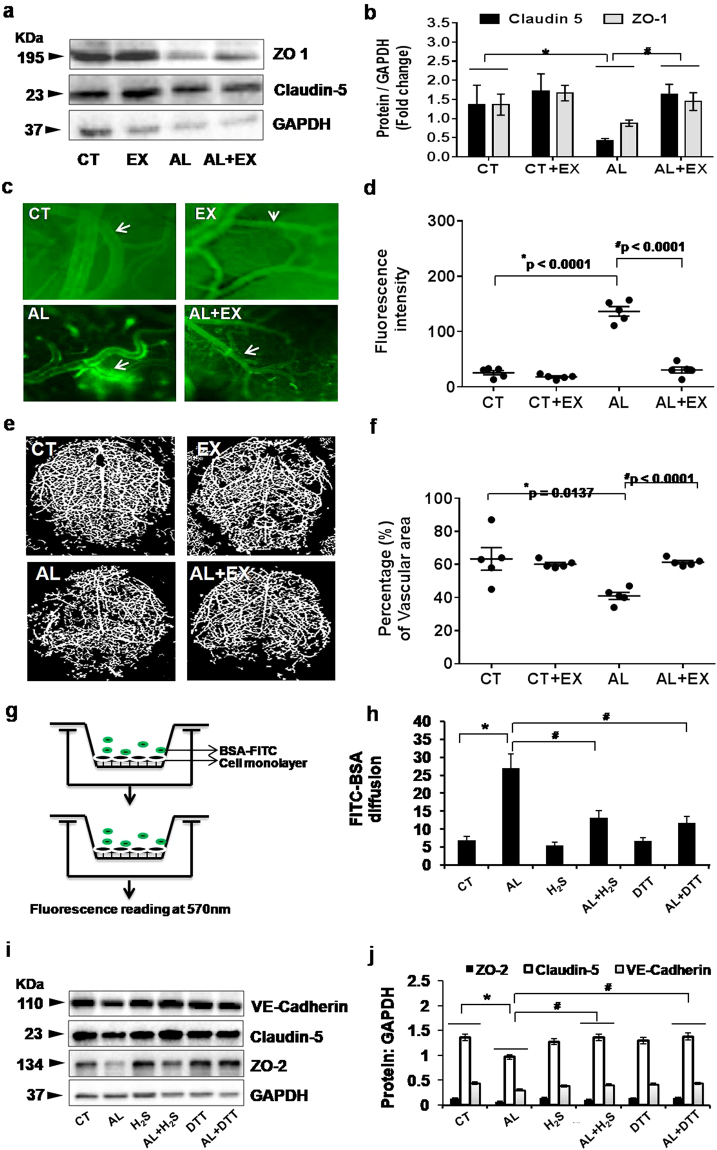
(a,b) Effect of exercise on alcohol induced vascular permeability and BBB dysfunction. Representative western blot analysis showing the levels of tight junction (TJ) proteins (ZO-1 and Claudin-5) in the different mice groups (a). Histogram showing the quantitative estimation of ZO-1 and Claudin-5 proteins after normalization with GAPDH (b). (c,d) Representative images showing fluorescent protein (FITC-BSA) leakage from pial vessels into brain parenchyma – indicating alteration in microvascular permeability in the different groups of mice (c). Scatter dot plot showing quantitative estimation of fluorescent intensity units (FIU) in the different mice groups after FITC-BSA injection (d). (e,f) Representative images of cerebral angiogram with barium sulfate contrast in experimental mice groups (e). Scatter dot plot showing the pattern of vascular density in the form of percentage of vascular area in the different mice groups (f). (g,h) Representative images for the in vitro model showing microvascular permeability in brain endothelial cells (bEnd.3 cells) by FITC-BSA diffusion assay. Fluorescence intensity of bovine serum albumin conjugated with FITC (BSA-488) in lower chambers of Transwells was measured by fluorimetry and presented as FIU (g). Histogram showing quantitative estimation of FIU in different experimental conditions after FITC-BSA treatment in Transwell chambers (h). (i,j) Representative western blot analysis showing the levels of junctional proteins (VE-Cadherin, Claudin-5 and ZO-2) in different experimental conditions of mouse brain endothelial cells (i). Histograms showing the quantitative estimation of ZO-2, Claudin-5 and VE-Cadherin proteins after normalization with GAPDH (j). All the data are represented as mean values ± standard error (SE) in 5 independent experiments. *,#p < 0.05 considered significant.*p < 0.05 vs. CT and #p < 0.05 vs. AL group. Uncropped blots for Fig. 6a,i are presented in Supplementary Fig. 6 and 7.

