Figure 7.
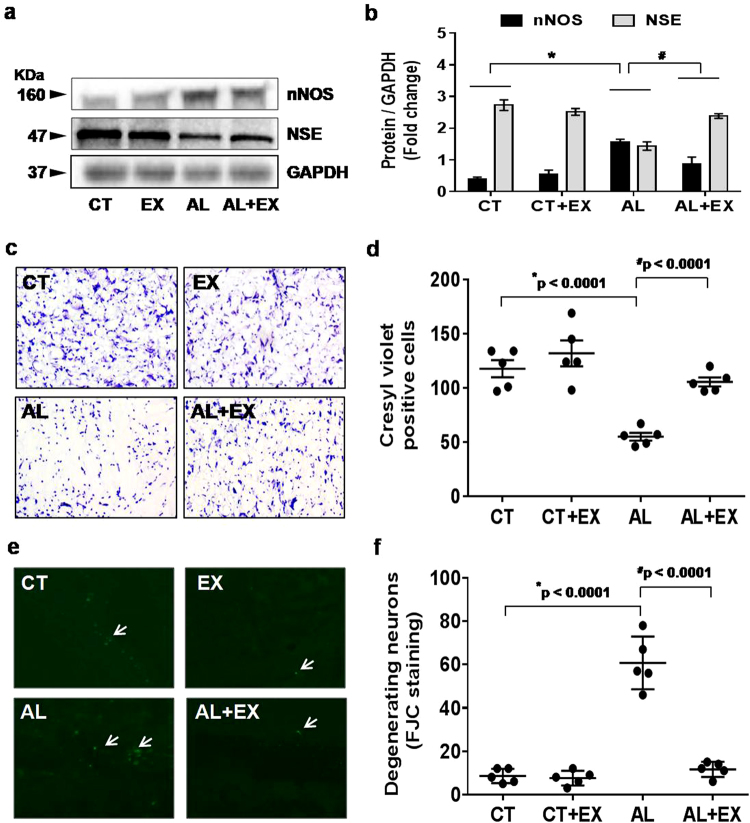
Effect of exercise on alcohol induced neuronal damage. (a,b) Representative western blot analysis showing the levels of neuronal proteins (NeuN and NSC) in different mice groups (a). Histogram showing the quantitative estimation of nNOS and NSE proteins after normalization with GAPDH (b). (c,d) Representative images showing coronal slices of mice brains stained with cresyl violet (40× magnification) (c). Scatter dot plot showing the number of cresyl violet positive cells in different groups of mice (d). (e,f) Representative images showing Fluoro-Jade C (FJC) staining in brain sections of the different groups of mice (10× magnification). A marked decrease of FJC-stained degenerating neurons (arrows) were observed in CT, EX and AL+EX groups, indicating a lesser degree of neuronal cell death. Brain sections of AL treated mice showing a greater number of FJC-positive neurons (arrows), reflecting increased neuronal cell death (e). Scatter dot plot showing the numbers of degenerating neurons in different experimental mice groups (f). All the data are represented as mean values ± standard error (SE) in 5 independent experiments. *,#p < 0.05 considered significant. *p < 0.05 vs. CT and #p < 0.05 vs. AL group. Uncropped blots for a are presented in Supplementary Fig. 8.

