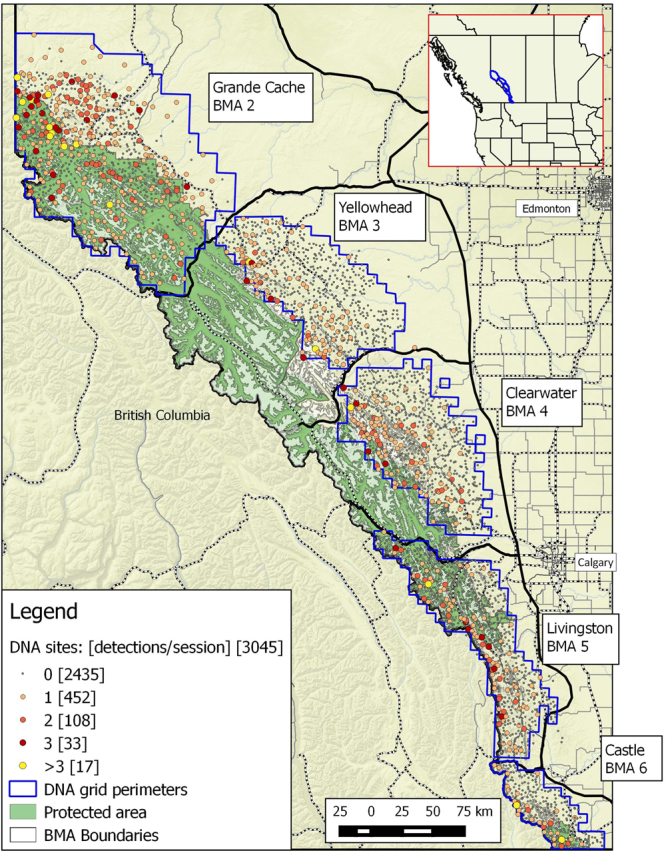
Figure 1.

Distribution of DNA hair snag sites in Alberta, Canada by each bear management area (BMA) sampled from 2004–8. Sites are categorized by the mean number of bears detected per session. Frequency of each detection/session category is provided in brackets. Grid perimeters are shown delineating the extent of areas sampled. A minimum of one site was placed in each 49 km2 cell for each DNA grid. Map was produced using QGIS software (v2.10.1; qgis.org).
