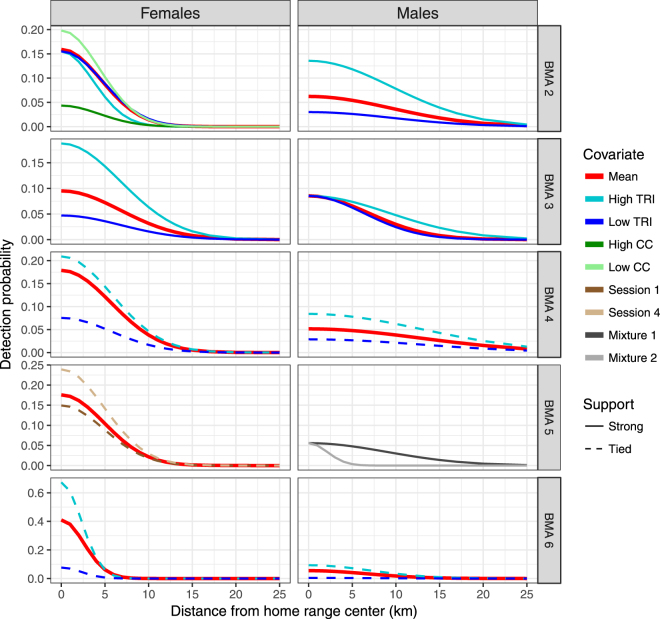
Figure 3.
Spatially explicit detection functions for male and female bears as a function of BMA for grizzly bears in Alberta for analysis of Alberta grizzly bear inventory data (2004–8). Note the different scales on the x and y axes. Detection functions are given for non-covariate models (Mean) and as a function of site covariates for g0 and σ. Relative support of covariates is delineated by line type. Strong support indicates that covariate models had AICc scores of greater than 2 units than constant models whereas tied support indicates that covariate model AICc scores were greater than constant models by less than 2 AICc units. See Appendix S1 for full details of this analysis.

