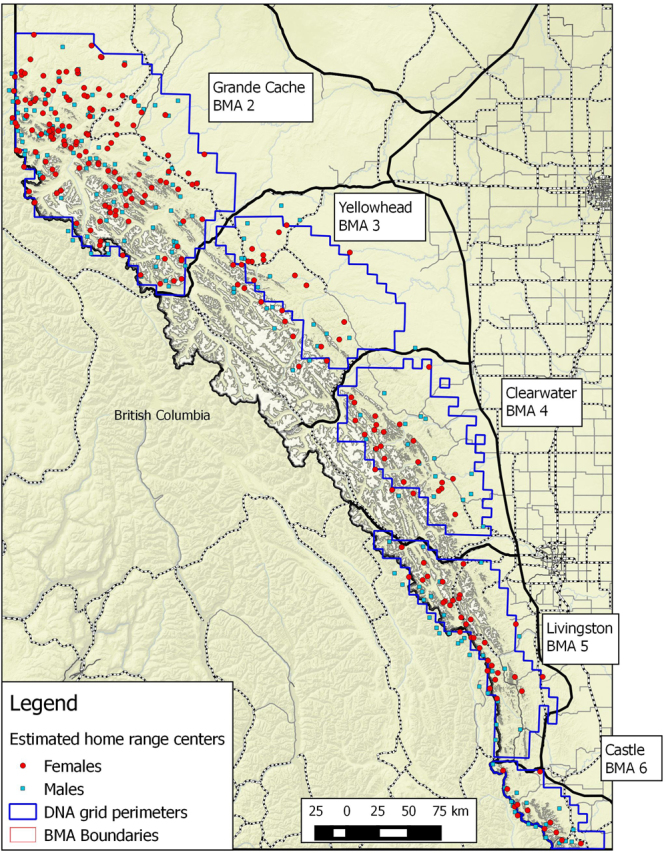
Figure 6.

Predicted home range centers from most supported detection models of Alberta grizzly bear inventory data (2004–8). The BMA and year it was sampled is labeled in each map. Map was produced using QGIS software (v2.10.1; qgis.org).

Predicted home range centers from most supported detection models of Alberta grizzly bear inventory data (2004–8). The BMA and year it was sampled is labeled in each map. Map was produced using QGIS software (v2.10.1; qgis.org).