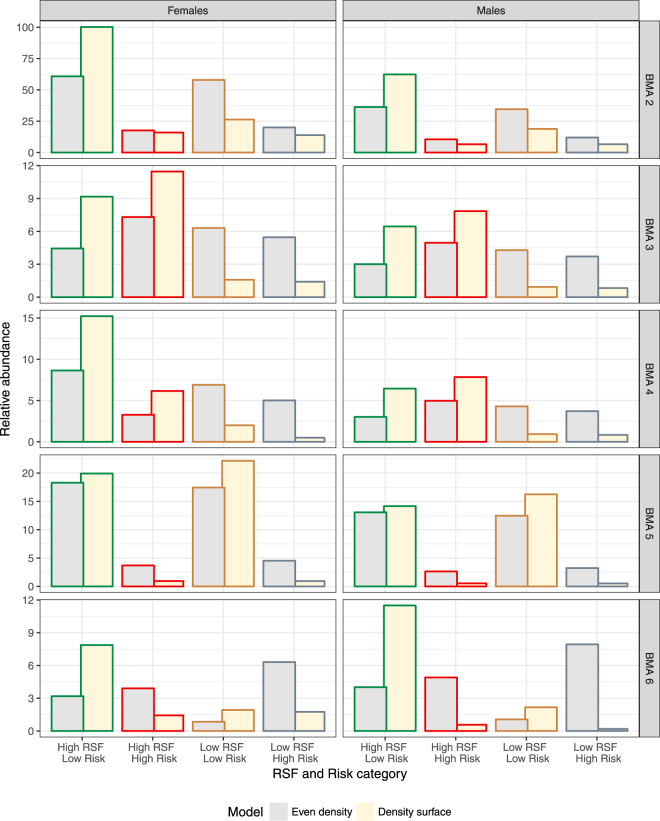
Figure 9.
Predicted relative abundance of female (left) and male (right) bears as a function of RSF and Risk categories by Bear Management area (graph row as labelled in right side of graph) based on density surface models and activity centers. Density surface predictions are based on the most supported density surface for each BMA (Table 2). RSF and Risk areas of “safe harbor” (high RSF and low risk) are outlined in green whereas areas of “attractive sink” are outlined in red (high RSF and low risk). Areas of low habitat value and risk are outlined in brown and areas of high risk and low habitat value are outline in grey.

