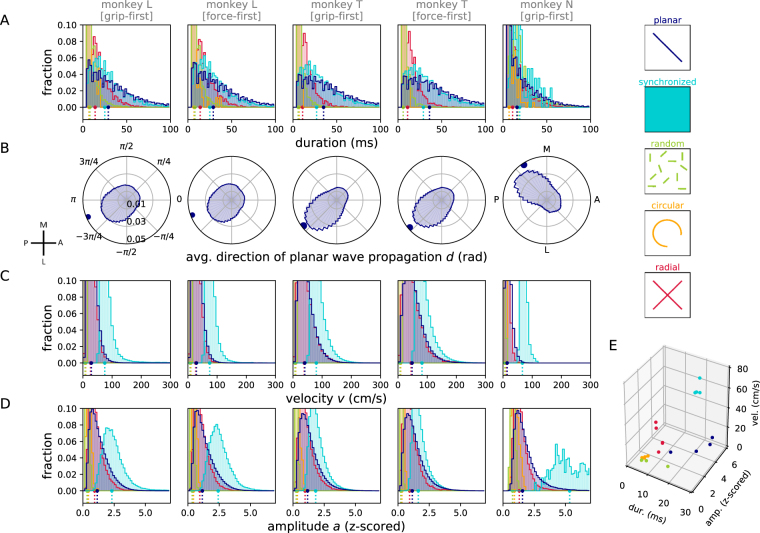
Figure 6.
Statistics of detected patterns. (A) Histogram of durations of epochs of consecutive time points classified as belonging to the same phase pattern (cf., Fig. 4A). (B–D) Distributions of the direction d(t) (panel B), phase velocity v(t) (panel C), and amplitude profile a(t) (panel D), as a function of the detected phase pattern. Data are separated (columns) according to monkey and recording condition (grip-first vs. force-first). Histograms for different phase patterns are plotted overlapping in the color corresponding to the legend on the right. For each phase pattern, a histogram entry in panels (B–D) represents the measured quantity averaged across the array calculated at a time point classified as that pattern. In panel B, the average direction of the phase gradient is plotted in brain coordinates by rotating the activity, and mirroring data along the medio-lateral axis for monkey T to compensate for the array placement in the opposite hemisphere as compared to L and N. Dots and dashed lines below indicate the medians of the corresponding distributions. (E) Joint representation of the medians of the distributions shown in panels A, C, and D. Each data point represents the median of one monkey in one recording condition for one pattern class (indicated by color).

