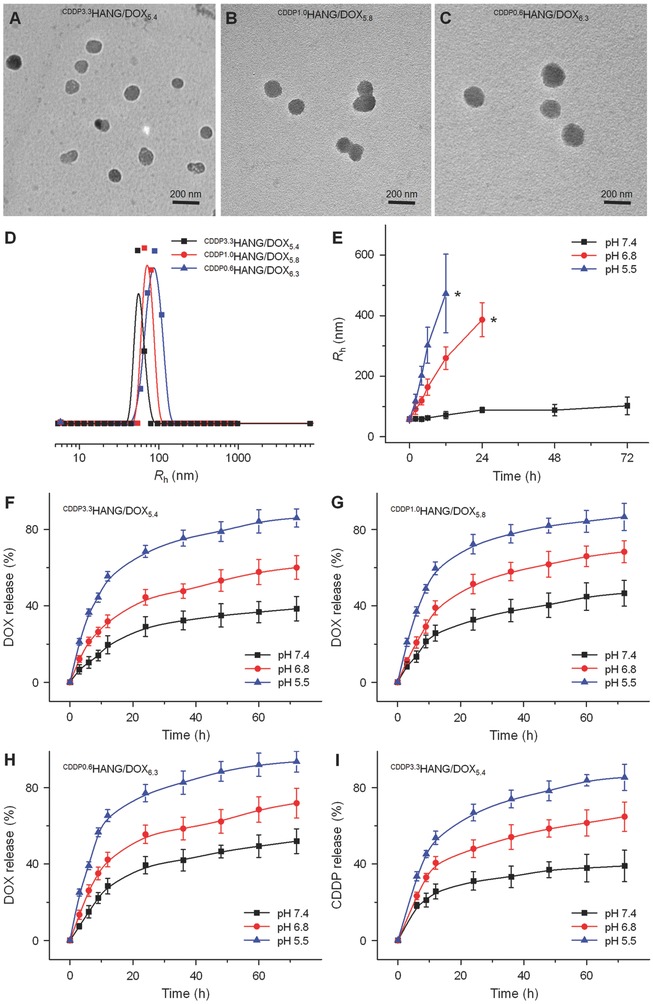
Figure 1.

Characterization of CDDPHANG/DOX. A−D) Typical TEM images and R hs of CDDPHANG/DOX samples with different feeding molar ratios of [CDDP]/[COOH]. Scale bars: 200 nm. E) Size changes of CDDPHANG/DOX in PBS buffer at various pH values versus time. Asterisks (*) represented the interruption of dynamic light scattering to the particles sizes. Time‐ and pH‐dependent DOX release profiles of F) CDDP3.3HANG/DOX5.4, G) CDDP1.0HANG/DOX5.8, H) CDDP0.6HANG/DOX6.3, and I) the relevant CDDP release profiles of CDDP3.3HANG/DOX5.4 in PBS at 37 °C.
