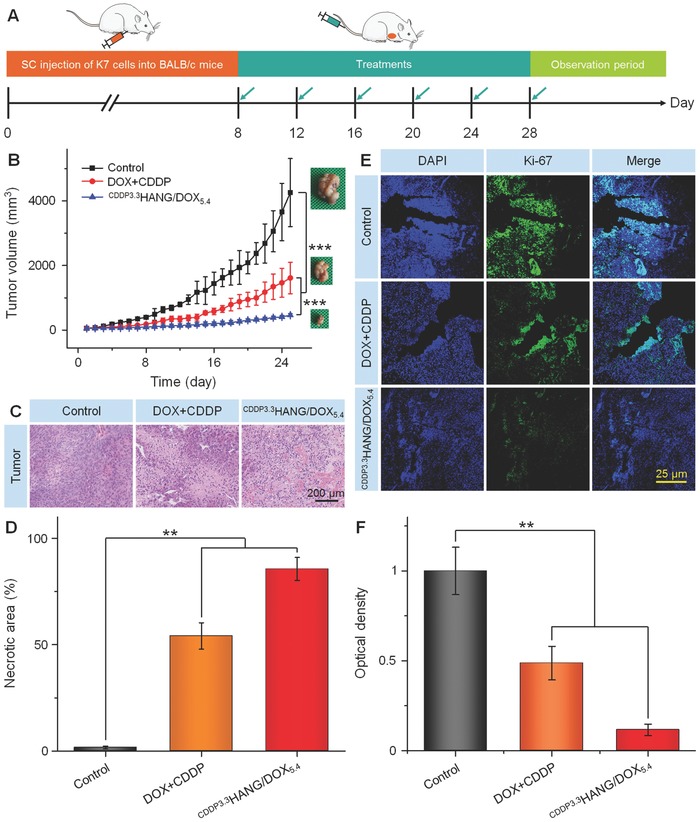
Figure 4.

In vivo antitumor efficacies. A) Experimental schedule for tumor induction and drug treatments. B) K7 tumor growth curves, C) histopathological (i.e., H&E) analyses (magnification: 200×), and D) the necrotic areas of tumor sections from H&E of K7 osteosarcoma‐xenografted mice after treatment with PBS as the control, free DOX plus CDDP, or CDDP3.3HANG/DOX5.4. E) Immunohistochemical (Ki‐67) analyses of tumor tissue sections after treatment of PBS as control, free DOX plus CDDP, or CDDP3.3HANG/DOX5.4. Magnification: 100×. F) Relative optical densities of tumor sections from Ki‐67. Data are presented as a mean ± SD (n = 7 for panel (B), n = 3 for panels (D) and (F); **P < 0.01, ***P < 0.001).
