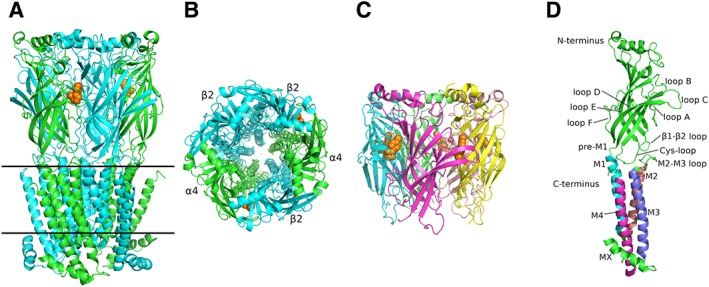
Figure 1.

Overall architecture of the α4β2 nAChR and α2‐ECD. (A) View of α4β2 parallel to the plasma membrane (PDB ID: 5KXI) (Morales‐Perez et al., 2016). α subunits are shown in green and β in cyan, while nicotine is in orange spheres. Solid lines indicate the approximate limits of the membrane. (Β) View of α4β2 along the channel axis. Colour coding as in (A). (C) Side‐view of α2‐ECD (PDB ID: 5FJV) (Kouvatsos et al., 2016). Each of the α2 subunit is coloured differently and epibatidine is shown in orange spheres. (D) The protomer of the human α4 subunit participating in α4β2 nAChR (PDB ID: 5KXI). The critical domains, characteristic of pLGICs, are shown. The ECD and the intracellular helix (MX) are coloured in green, while each TM helix is in different colour. The coordinates of all the structures depicted were retrieved from Protein Data Bank (http://www.wwpdb.org), and PyMol (http://www.pymol.org) was used to generate the figures.
