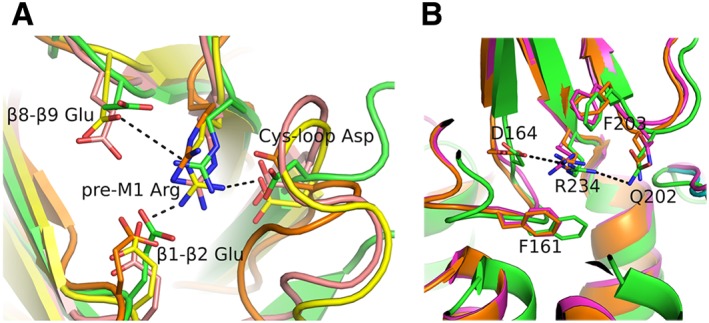
Figure 4.

Membrane‐facing networks. (A) Close view of the interactions between structural elements at the lower part of the ECDs, viewed from the bottom of the ECD. These interactions are present in most of the resolved structures of pLGICs [α9‐ECD in green, PDB ID: 4D01 (Zouridakis et al., 2014); GABAA receptor in pink, PDB ID: 4COF (Miller and Aricescu, 2014); 5‐HT3 receptor in yellow, PDB ID: 4PIR (Hassaine et al., 2014); GLIC in orange, PDB ID: 3EAM (Bocquet et al., 2009)]. The invariant arginine at the end of β10 strand or pre‐M1 loop interconnects Cys‐loop, β1–β2 loop and in most cases β8–β9 loop. (B) Side view of the superimposed structures of the glycine receptor determined in closed (PDB ID: 3JAD), open (PDB ID: 3JAE) and desensitized (PDB ID: 3JAF) states (Du et al., 2015), shown in green, magenta or orange respectively. The interaction network in (B) is shown in equatorial orientation, while the aromatic residues that sandwich the charged residues of the network are in axial positions. Representative interactions are shown in black dashed lines. The coordinates of all the structures depicted were retrieved from Protein Data Bank (http://www.wwpdb.org), and PyMol (http://www.pymol.org) was used to generate the figures.
