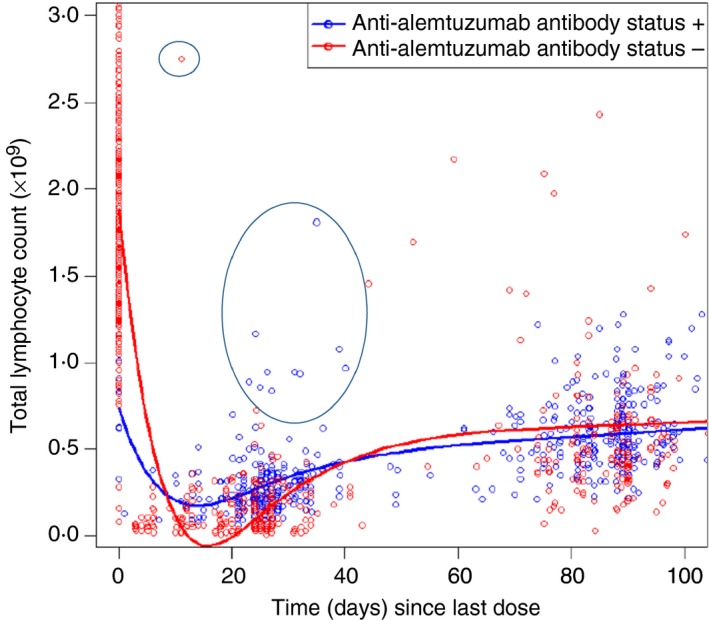
Figure 1.

Lymphocyte depletion and anti‐alemtuzumab antibody status. Scatterplot of peripheral blood lymphocyte levels over time and anti‐alemtuzumab antibody status in people with in the MS CARE studies. The diagram is reproduced from documents in the public domain,14 following correspondence with both the European Medicines Agency and Sanofi Genzyme. The latter allowed the reproduction. Data within the first month will show the depletion kinetics. At later time‐points, the data may be confounded by rapid re‐populators. The circles highlight an antibody‐negative individual who was a poor depleter and antibody‐positive individuals who are poor depleters.
