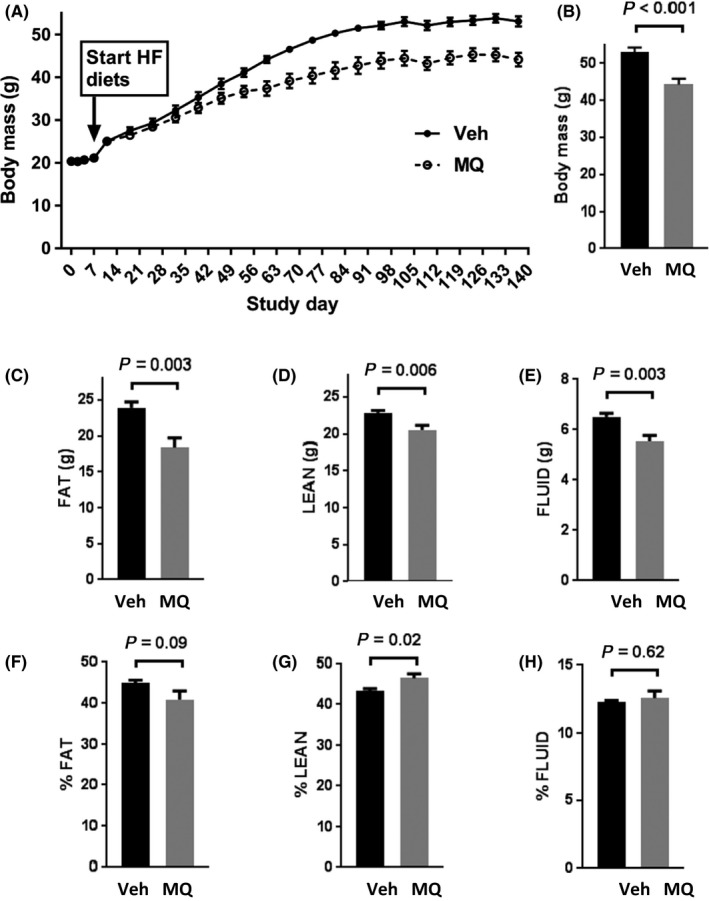
Figure 2.

Body mass and composition. (A) Change in body mass over time in high fat (HF)‐fed, vehicle (water plus cyclodextrin) (Veh)‐treated mice and HF‐fed mitoquinone (MQ)‐treated (complexed with CD) mice. (B) Body mass at day 137 in the Veh and MQ groups. (C‐E) Body composition expressed in grams of fat, lean, and fluid mass, respectively, determined by NMR. (F‐H) Body composition expressed as % fat, % lean or % fluid mass determined by NMR. Data represent mean ± SE. n = 9 for Veh, n = 10 for MQ mice. P values were determined by 2‐tailed, unpaired t test
