
Figure 5.
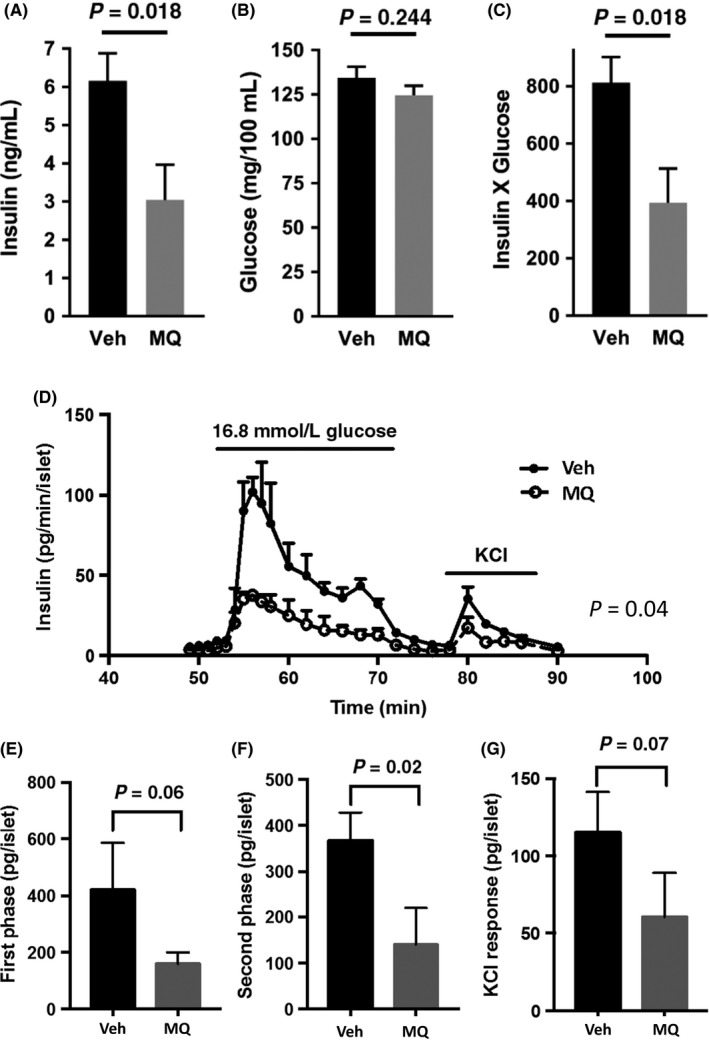
Whole body plasma insulin and glucose and glucose stimulated insulin secretion from isolated perifused islets. (A and B) Plasma insulin and glucose after overnight fast. (C) Insulin x glucose product. Data in (A‐C) represent mean ± SE. n = 9 for Veh, n = 10 for mitoQ (MQ) mice. (D) Insulin secretion in perfusate obtained from islets isolated from mice treated with Veh or MQ. (E‐G) Area under the curves of (D) for first phase insulin secretion (E, time 55‐60), second phase (F, time 62‐72), and KCL induced (G, time 80‐86). Data in (D‐G) represent mean ± SE. n = 3 per group. P values were determined by 2‐tailed, unpaired t test except for (D) in which a 2 way anova test was performed using the factors, time (as a repeated measure) and treatment group. The P value shown in (D) represents the treatment effect. As expected, both time and interaction were significant (P < .0001) consistent with the concept that the effet of mitoQ is time dependent