Figure 2.

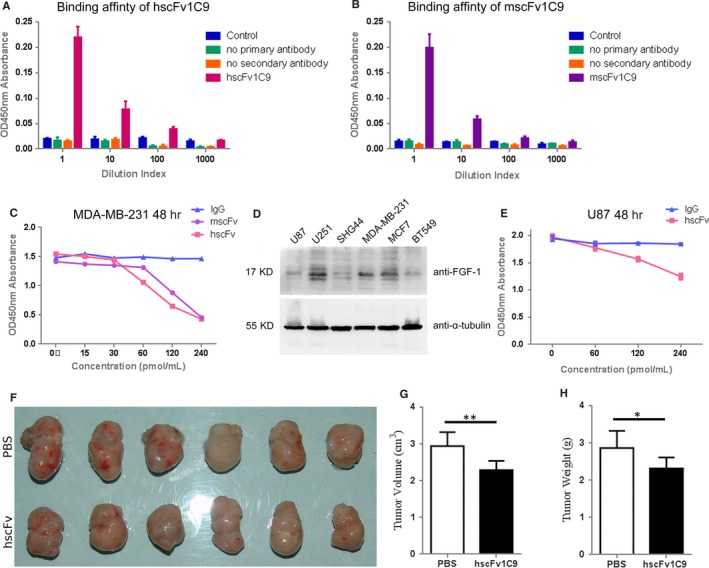
hscFv1C9 inhibited tumour cells growth in vitro and in vivo. Home‐made ELISA showed hscFv1C9 (A) and mscFv1C9 (B) have similar binding affinity to FGF‐1 at comparable dilution. A CCK‐8 assay was used to measure cell density after the indicated treatment. PBS was used in 0 pmol/mL group as the control of this assay. (C) Both hscFv1C9 and mscFv1C9 showed inhibitory effects on MDA‐MB‐231 cell proliferation in a dosage‐dependent manner. MDA‐MB‐231 cells were incubated with antibodies for 48 h and followed by CCK‐8 reaction for 180 min. (D) Western blotting analysis of FGF‐1 expression in glioma and breast cancer cell lines. (E) U87 cells were incubated with hscFv1C9 for 48 h and followed by CCK‐8 reaction for 120 min. Cell growth of U87 cells was prohibited by hscFv1C9. (F) Isolated tumours from nude mice. (G) and (H) Statistical analyses of tumours size and tumour weight from 2 groups. Mann‐Whitney U test was used for statistical analysis. Data were shown as Mean ± SD. ** indicated P value < .01; * indicated P value < .05
