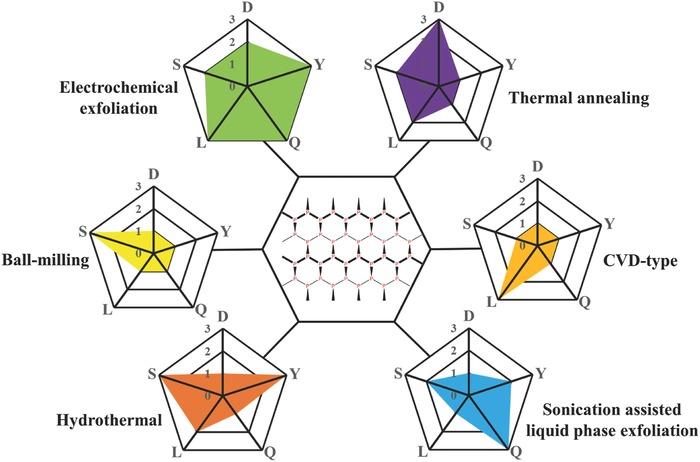
Figure 11.

Comparison of six 2D BP fabrication methods. Each method was evaluated in terms of duration (D), yield (Y), 2D BP quality (Q), lateral dimension (L), and scalability (S) of the overall fabrication process. For D, 1 = high, 2 = moderate, and 3 = low. For Y, Q, L, and S, 1 = low, 2 = moderate, and 3 = high.
