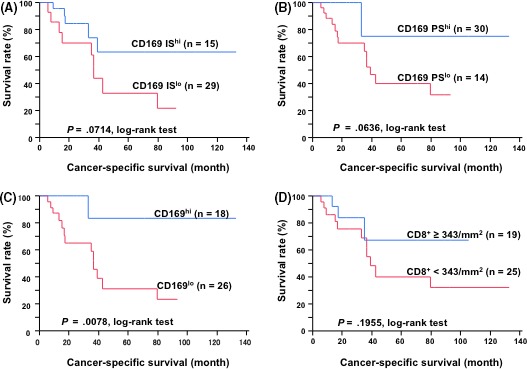
Figure 3.

Kaplan–Meier's cancer‐specific survival curves for patients with bladder cancer. A, The patients were divided into 2 groups according to their intensity score: 0‐1 was defined as low intensity and 2‐3 was defined as high intensity. IS, intensity score. B, The patients were divided into 2 groups according to their proportion score: 0‐2 was defined as a low proportion and 3 was defined as a high proportion. PS, proportion score. C, The patients were divided into 2 groups according to their total CD169 score: 0‐4 was defined as a low score and 5‐6 was defined as high score. D, The patients were divided into 2 groups according to the amounts of CD8+ T cells in the tumor
