
Figure 1.
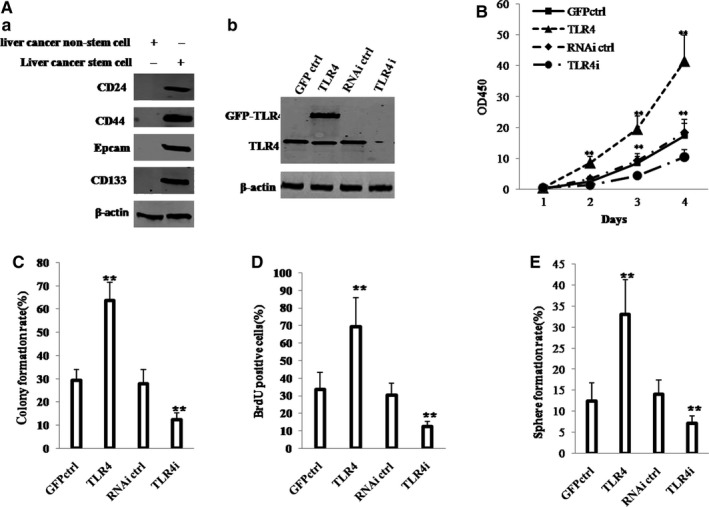
TLR4 accelerates hLCSCs growth in vitro. A, (a) Western blotting analysis of expression of CD133, CD44, CD24 and EpCAM in hLCSCs and non‐hLCSCs. (b) Western blotting analysis of TLR4 expression in four hLCSC lines. β‐Actin was used as internal control. B, Cell growth assay using CCK8. C, Soft‐agar colony formation assay. D, S phase cells assay using BrdU. E, Cell sphere formation ability. Each value was presented as mean ± standard error of the mean (SEM). mean ± SEM. **P < .01; *P < .05. For all Western blotting, we repeated the experiments for three times. We measured grey value of the bands for quantification. Each value was presented as mean ± standard error of the mean (SEM) (Student's t test)