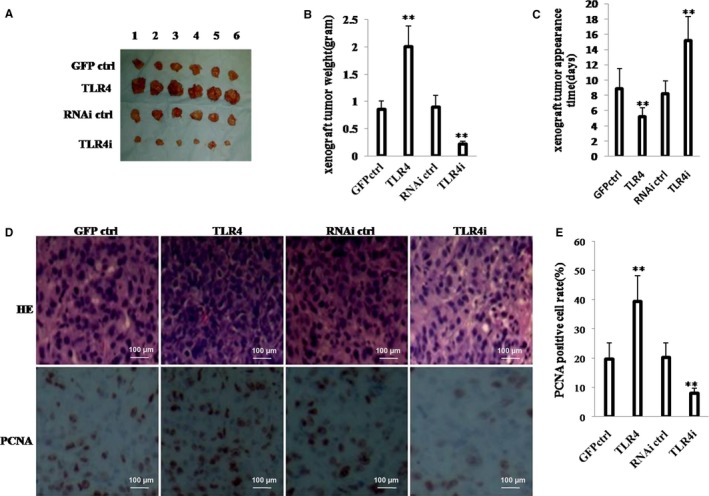
Figure 2.

TLR4 accelerates hLCSCs growth in vivo. A, The photograph of xenograft tumours derived from four hLCSC lines injected into mice. B, The wet weight of xenograft tumours. C, The appearance time of xenograft tumours. D, Histological haematoxylin‐eosin (HE) staining (upper pictures) and anti‐PCNA immunostaining (lower pictures) of xenograft tumours. (original magnification × 100). E, PCNA‐positive cell analysis of xenograft tumours. Each value was presented as mean ± standard error of the mean (SEM). mean ± SEM. **P < .01; *P < .05. For all Western blotting, we repeated the experiments for three times. We measured grey value of the bands for quantification. Each value was presented as mean ± standard error of the mean (SEM) (Student's t test).
