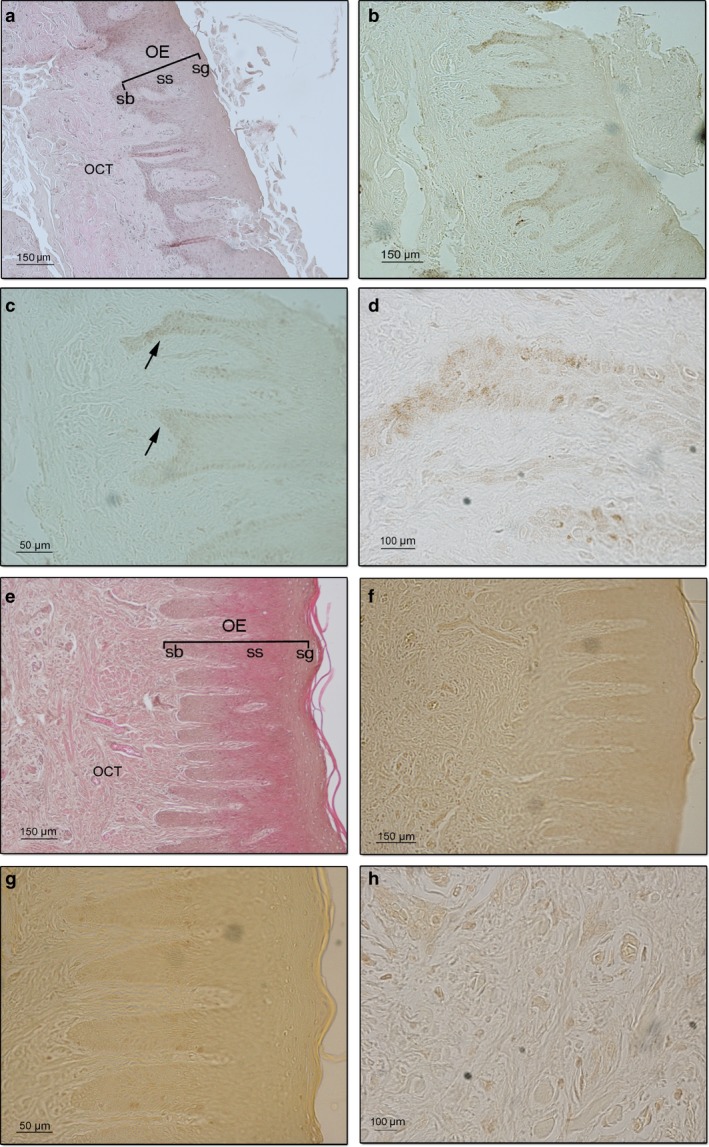
Figure 2.

Representative sections of oral long post mortem interval (LPMI) gingival mucosa showing hypoxia inducible factor (HIF)‐1α protein expression. (a) Haematoxylin–eosin staining of gingival tissue showing the oral epithelium (OE) and the sub‐oral connective tissue (SCT; magnification 10 ×; scale bar: 150 μm). (b) No signal corresponding to HIF‐1α protein is observed (magnification 10 ×; scale bar: 150 μm). (c) A very weak signal of HIF‐1α protein is detected in the stratum basale (arrow; magnification 20 ×; scale bar: 50 μm). (d) No positive cells of the SCT are detected (magnification 100 ×; scale bar: 100 μm). Representative sections of gingival mucosa from healthy donors (control samples) showing HIF‐1α protein expression. (e) Haematoxylin–eosin staining of gingival mucosa showing the OE and the SCT (magnification 10 ×; scale bar: 150 μm). (f) No signal corresponding to HIF‐1α expression is observed in the oral mucosa (magnification 10 ×; scale bar: 150 μm). (g) At higher magnification, no positive cells are detected in the layers of the OE (magnification 20 ×; scale bar: 50 μm) or in the SCT (h) (magnification 100 ×; scale bar: 100 μm).
