
Figure 1.
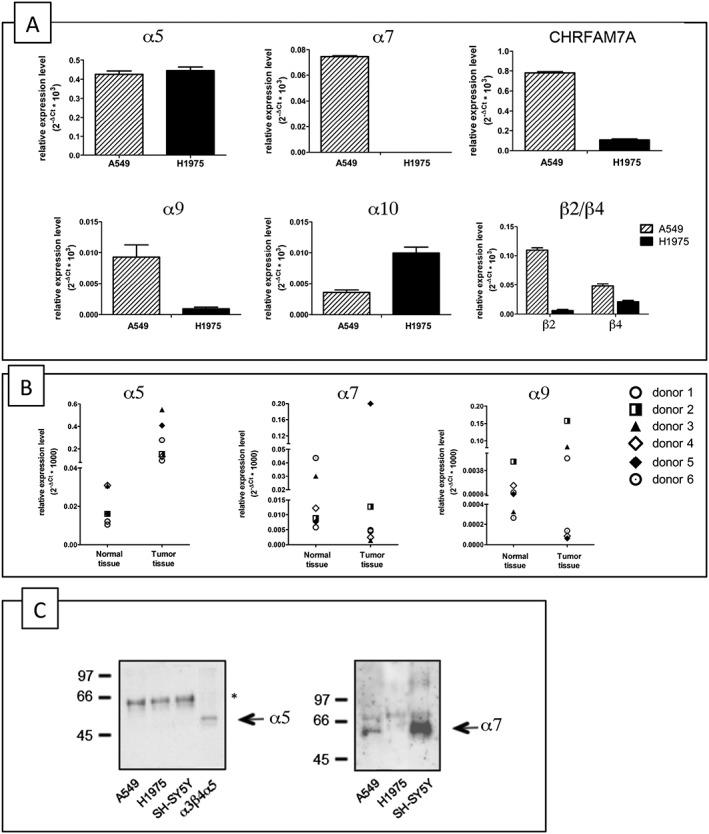
mRNA and protein expression level of different nAChR subunits in adenocarcinoma A549 and H1975 cell lines and human samples. (A) q‐PCR analysis of the human adenocarcinoma cell lines A549 and H1975. Data are shown as relative expression ±SD, normalized to the endogenous GAPDH expression, according to the 2−ΔCt method. (B) q‐PCR analysis of α5, α7 and α9 nAChR subunits in human normal lung parenchyma and lung adenocarcinoma tissues. The symbols indicate the four donors. The data are shown as relative expression levels normalized to endogenous 18S expression, in accordance with the 2−ΔCt method. (C) Western blot analysis of the α‐Bgtx affinity receptors purified from A549, H1975 and SH‐SY5Y cells. Proteins were separated on 9% acrylamide SDS gels, transferred to nitrocellulose and probed with Abs directed against the α5 (left) or α7 (right) subunits. Extract from cells transfected with α5 subunit (α3α5β4) was used as control for α5 labelling. The asterisk indicates an aspecific band.